
Page 18 - 南京医科大学自然版
P. 18
第44卷第10期
·1334 · 南 京 医 科 大 学 学 报 2024年10月
A S100A4 DKR S100A4 WT B 0.000 56
2.50 Genes
Read count frequency
2.25
2.00 0.000 52
1.75
1.50
-3.0 TSS TES3.0 Kb -3.0 TSS TES3.0 Kb 0.000 48
0.000 44
8
-1 000 bp -500 bp TSS 500 bp 1 000 bp
Genomic region(5′→3′)
D
Wnt signaling pathway
Wound healing
Regulation of actin filament⁃based process
6 Regulation of Wnt signaling pathway
Epithelial cell migration
Axon guidance BP
Genes Cell⁃cell adhesion via plasma⁃membrane adhesion molecules
Extracellular matrix organization
Cell⁃matrix adhesion
Actin⁃mediated cell contraction
4
Cell⁃cell junction P adjust
Collagen⁃containing extracellular matrix
Microtubule
Neuron to neuron synapse
Cortical cytoskeleton 0.015
Collagen trimer CC
Actomyosin 0.010
2 Cortical actin cytoskeleton
Contractile actin filament bundle 0.005
Catenin complex
GTPase regulator activity
Actin binding
GTPase activator activity
Metal ion transmembrane transporter activity
0 Cadherin binding MF
-3.0 TSS TES3.0 Kb -3.0 TSS TES3.0 Kb Actin filament binding
Gene distance(bp) Gene distance(bp) Calmodulin binding
Extracellular matrix structural constituent
Voltage⁃gated cation channel activity
Transmembrane receptor protein tyrosine kinase activity
0 50 100 150 200 250
Counts
C E CSF3R
GADD45A
MAP3K6
RPS6KA1
PLA2G5
PLA2G2E KEGG enrichment analysis
ITGA10
COL11A1
VAV3 Pathways in cancer
WASF2
PTGFR
HTR6 MAPK signaling pathway
CALML6
CTNNBIP1
DVL1 Focal adhesion P⁃value
NEGR1
PTPRF Regulation of actin cytoskeleton 0.010
SDC3
Promoter(≤1 kb)(20.85%) HSPG2 Calcium signaling pathway 0.005
Promoter(1-2 kb)(5.20%) AGRN
ABL2 Wnt signaling pathway
Promoter(2-3 kb)(4.20%) SHC1 Count
5′ UTR(0.60%) WNT2B Cell adhesion molecules 60
PTCH2
90
3′ UTR(3.91%) WNT4 ECM⁃receptor interaction 120
1st exon(1.54%) TGFB2 ErbB signaling pathway 150
Other exon(5.92%) CASP9 Hedaehog signaling pathway
1st intron(10.56%) PIK3CD Pancreatic cancer
Other intron(20.41%)
Downstream(≤300)(0.11%) 0.02 0.03 0.04 0.05 0.06 0.07
Distal intergenic(26.7%) Gene ratio
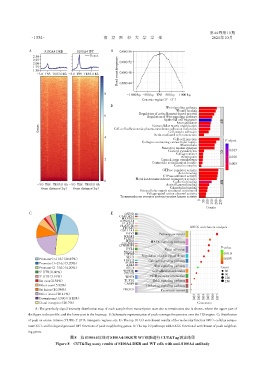
A:The genebody signal intensity distribution map of each sample from transcription start site to termination site is shown,where the upper part of
the figure is the profile,and the lower part is the heatmap. B:Schematic representation of peak coverage frequencies over the TSS region. C:Distribution
of peak on exons,introns,5′UTR,3′UTR,intergenic regions,etc. D:The top 10 GO enrichment results of the molecular function(MF),cellular compo⁃
nent(CC),and biological process(BP)functions of peak neighboring genes. E:The top 10 pathways with KEGG functional enrichment of peak neighbor⁃
ing genes.
图8 抗S100A4抗体对S100A4⁃DKR和WT细胞进行CUT&Tag测定结果
Figure 8 CUT&Tag assay results of S100A4⁃DKR and WT cells with anti⁃S100A4 antibody