
Page 75 - 南京医科大学学报自然科学版
P. 75
第44卷第1期 张 燕,黄 剑,刘 红,等. 江苏省生物医学实验室科研人员暴露调查分析[J].
2024年1月 南京医科大学学报(自然科学版),2024,44(01):065-071 · 69 ·
A 2 000 400 *** 200 ***
*** ( ng/g ) 150
( μg/g ) 1 500 ( μg/g ) 300 pyrene 100
200
1 000
DEHP Bisphenol A [ a ]
500 100 Benzo 50
0 0 0
Control group Test group Control group Test group Control group Test group
B 400 *** 200 ***
2 000
*** 300 ( ng/g ) 150
( μg/g ) 1 500 ( μg/g ) 200 pyrene 100
1000
DEHP Bisphenol A [ a ]
500 100 Benzo 50
0 0 0
Control group Test group Control group Test group Control group Test group
C 400 200
2 000 ***
*** *** ( ng/g )
( μg/g ) 1 500 ( μg/g ) 300 pyrene 100
200
1 000
DEHP 500 Bisphenol A 100 [ a ] Benzo 50
0 0 0
Control group Test group Control group Test group Control group Test group
D 400 100
2 000
*** 300 ( ng/g ) 80
( μg/g ) 1 500 ( μg/g ) 200 pyrene 60
1 000
DEHP 500 Bisphenol A 100 [ a ] Benzo 40
20
0 0 0
Control group Test group Control group Test group Control group Test group
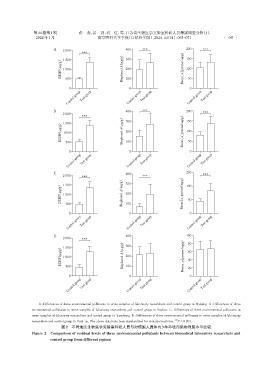
A:Differences of three environmental pollutants in urine samples of laboratory researchers and control group in Nanjing. B:Differences of three
environmental pollutants in urine samples of laboratory researchers and control group in Suzhou. C:Differences of three environmental pollutants in
urine samples of laboratory researchers and control group in Yancheng. D:Differences of three environmental pollutants in urine samples of laboratory
researchers and control group in Huai’an. The above data have been standardized for urinary creatinine. *** P < 0.001.
图2 不同地区生物医学实验室科研人员与对照组人员体内3种环境污染物残留水平比较
Figure 2 Comparison of residual levels of three environmental pollutants between biomedical laboratory researchers and
control group from different regions