Page 77 - 南京医科大学自然版
P. 77

第44卷第7期         王 皓,杜昱升,王       友,等. 基于光谱CT和影像组学特征的机器学习模型和列线图预测甲
                  2024年7月              状腺结节良恶性[J]. 南京医科大学学报(自然科学版),2024,44(7):958-965                   ·961 ·


                                                   表1  训练集与验证集的基本信息
                                        Table 1 Basic information of the training and validation sets
                                                                                                  2
                      Information      Training set(n=100)  Validation set(n=43)  Total(n=143)   χ /t/Z    P
                 Clusters[n(%)]                                                                  0.794    0.068
                     Benign                 31(31)             15(35)             046(32)
                     Malignant              69(69)             28(65)             097(68)
                 Sex[n(%)]                                                                      -0.104    0.747

                     Female                 83(83)             34(79)             117(82)
                     Male                   17(17)             09(21)             026(18)
                 Age(years,x ± s)        53.00 ± 13.73       49.14 ± 16.63      51.84 ± 14.71   -1.339    0.185
                 NIC(x ± s)               0.56 ± 0.19         0.57 ± 0.20        0.56 ± 0.19     0.383    0.705
                 λHu [M(P25,P75)]       2.83(2.09,3.64)     2.85(2.21,3.33)    2.85(2.12,3.58)  -0.288    0.773
                 FT3(pmol/L,x ± s)        4.68 ± 0.69         4.64 ± 0.60        4.67 ± 0.66    -0.325    0.746
                 FT4[pmol/L,M(P25,P75)]  16.45(14.17,18.80)  15.15(14.00,19.30)  16.30(14.10,18.90)  -0.326  0.745
                 TSH[mU/L,M(P25,P75)]   1.72(1.33,2.78)     1.53(1.21,2.64)    1.65(1.27,2.74)  -0.564    0.573


                   A      36     33     16      6      3                 B   6056544540363531302523201811 8 10 8 7 6 6 6 5 4 4 2 2 2 1
                        3
                                                                         0.26
                        2
                                                                         0.24
                        1                                                0.22
                      Coefficients  -1 0                                Mean⁃squared error  0.20


                       -2                                                0.18
                       -3                                                0.16
                       -4
                                                                         0.14
                          -6     -5     -4      -3     -2                    -6     -5     -4     -3     -2
                                            ln(λ)                                           ln(λ)
                 C                                                         D
                          Original_firstorder_Minimum
                                                                                3
                                                                                                ***
                        Original_firstorder_10Percentile
                                                                                2
                Original_glszm_LowGrayLevelZoneEmphasis                         1
                                                                              Radscore  0
                Log.sigma.3.0.mm.3D_firstorder_90Percentile
                                                                               -1
                            Original_ngtdm_Busyness
                                                                               -2
                         Log.sigma.4.0.mm.3D_glcm_Id
                                                                               -3
                                               -0.2   0     0.2  0.4
                                                                                        Benign      Malignant
                                                       Weight

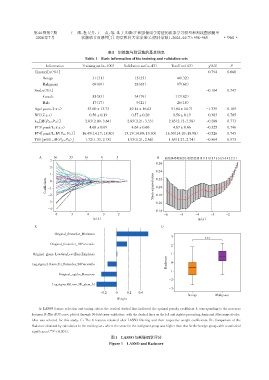
                   A:LASSO feature selection and tuning,where the vertical dashed line indicated the optimal penalty coefficient λ corresponding to the non⁃zero
                features. B:The AUC curve plotted through 10⁃fold cross⁃validation,with the dashed lines on the left and right representing λmin and λ1se respectively,
                λ1se was selected for this study. C:The 6 features retained after LASSO filtering and their respective weight coefficients. D :Comparison of the
                Radscore obtained by calculation in the training set,where the score for the malignant group was higher than that for the benign group,with a statistical
                        ***
                significance( P < 0.001).
                                                    图1   LASSO与影像组学评分
                                                   Figure 1  LASSO and Radscore
   72   73   74   75   76   77   78   79   80   81   82