


Page 46 - 南京医科大学自然版
P. 46
第45卷第4期
·482 · 南 京 医 科 大 学 学 报 2025年4月
A B D
Sagittal view Axial view 12 000 HU=2 031+10.61×ρ 500 *** *** *** *** ***
2
1 mm 1 mm R =0.998 1 (μm) 400
9 000 P < 0.001
0 d 300
HU 6 000 Tooth movement 200
3 d 3 000 100 0
0
0 200 400 600 800 0 3 7 14 21 28
3
7 d Density(mg/cm ) Time(d)
A C E
Posterior palatine foramen
d Palatal plane
14 M2 z M1 M2 1 mm
z
M1
d O C1 C2
21 y
x D
x
O
d
28
y
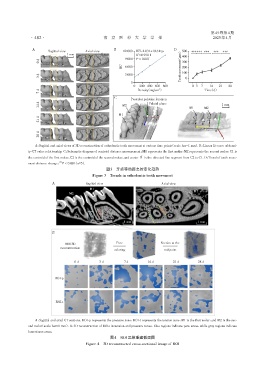
A:Sagittal and axial views of 3D reconstruction of orthodontic tooth movement at various time points(scale bar=1 mm). B:Linear fit curve of densi⁃
ty⁃CT value relationship. C:Schematic diagram of centroid distance measurement:M1 represents the first molar,M2 represents the second molar,C1 is
the centroid of the first molar,C2 is the centroid of the second molar,and vector D is the directed line segment from C2 to C1. D:Trend of tooth move⁃
***
ment distance change, P < 0.001(n=5).
图3 牙齿移动距离的变化趋势
Figure 3 Trends in orthodontic tooth movement
A Sagittal view Axial view
M1
M1
M2
p
p
t t
1 mm 1 mm
B
Pore Section at the
ROI 3D
reconstruction
coloring midpoint
0 d 3 d 7 d 14 d 21 d 28 d
ROI⁃p
ROI⁃t
A:Sagittal and axial CT sections. ROI⁃p represents the pressure zone,ROI⁃t represents the tension zone,M1 is the first molar,and M2 is the sec⁃
ond molar(scale bar=1 mm). B:3D reconstruction of ROIs in tension and pressure zones. Blue regions indicate pore areas,while gray regions indicate
bone tissue areas.
图4 ROI三维重建截面图
Figure 4 3D reconstructed cross⁃sectional image of ROI

