


Page 121 - 南京医科大学自然版
P. 121
第46卷第7期       张  梦,汤    婷,潘志娟,等. 小细胞肺癌患者化疗期间肺部感染风险评分模型的构建与验证[J].
                  2026年7月                     南京医科大学学报(自然科学版),2026,46(7):1064-1072                      ·1067 ·

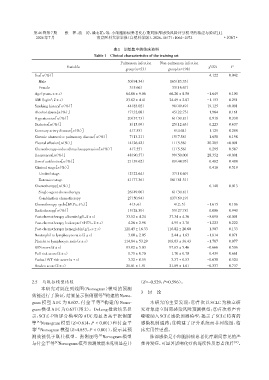
                                                     表1   训练集中的临床资料
                                            Table 1 Clinical characteristics of the training set

                                                         Pulmonary infection  Non⁃pulmonary infection
                                                                                                  2
                                Variable                                                         χ /Z/t     P
                                                           group(n=53)         group(n=198)
                 Sex[n(%)]                                                                        4.122    0.042
                   Male                                     50(94.34)          165(83.33)
                   Female                                    3(5.66)           033(16.67)
                 Age(years,x ± s)                          64.00 ± 9.06        66.20 ± 8.50      -1.649    0.100
                 BMI(kg/m ,x ± s)                          23.82 ± 4.41        24.49 ± 2.87      -1.153    0.251
                         2
                 Smoking history[n(%)]                      44(83.02)          098(49.49)        19.125   <0.001
                 Alcohol abuse[n(%)]                        17(32.08)          045(22.73)         1.964    0.161
                 Hypertension[n(%)]                         20(37.73)          061(30.81)         0.918    0.338
                 Diabetes[n(%)]                             08(15.09)          025(12.63)         0.223    0.637
                 Coronary artery disease[n(%)]               4(7.55)            08(4.04)          1.129    0.288
                 Chronic obstructive pulmonary disease[n(%)]  07(13.21)         15(7.58)          1.658    0.198
                 Pleural effusion[n(%)]                     14(26.42)           11(5.56)         20.285   <0.001
                 Chemotherapy⁃induced myelosuppression[n(%)]  4(7.55)           11(5.56)          0.295    0.587
                 Hoarseness[n(%)]                           48(90.57)          099(50.00)        28.352   <0.001
                 Use of antibiotics[n(%)]                   21(39.62)          089(44.95)         0.482    0.488
                 Clinical stage[n(%)]                                                             0.416    0.519
                   Limited stage                            12(22.64)          037(18.69)
                   Extensive stage                          41(77.36)          161(81.31)
                 Chemotherapy[n(%)]                                                               6.148    0.013
                   Single⁃agent chemotherapy                26(49.06)          061(30.81)
                   Combination chemotherapy                 27(50.94)          137(69.19)
                 Chemotherapy cycle[M(P25,P75)]              4(3,6)              4(2,5)          -1.615    0.106
                 Radiotherapy[n(%)]                         15(28.30)          055(27.78)         0.006    0.940
                 Post⁃chemotherapy albumin(g/L,x ± s)      33.52 ± 4.24        37.34 ± 4.36      -5.690   <0.001
                 Post⁃chemotherapy leukocyte(×10 /L,x ± s)  04.26 ± 2.98       04.95 ± 3.78      -1.223    0.222
                                          9
                 Post⁃chemotherapy hemoglobin(g/L,x ± s)  121.43 ± 16.33      116.82 ± 20.60      1.507    0.133
                 Neutrophil to lymphocyte ratio(x ± s)     03.00 ± 2.05        02.44 ± 1.63      -1.814    0.071
                 Platelet to lymphocyte ratio(x ± s)      114.84 ± 53.29      103.63 ± 36.43     -1.787    0.077
                 KPS score(x ± s)                          93.02 ± 5.03        97.65 ± 5.46      -0.666    0.506
                 Fall risk score(x ± s)                    01.75 ± 0.70        01.70 ± 0.70       0.439    0.661
                 Padua DVT risk score(x ± s)               03.32 ± 0.55        03.37 ± 0.53      -0.638    0.524
                 Braden score(x ± s)                       21.81 ± 1.51        21.89 ± 1.61      -0.337    0.737


                2.5  与既往模型比较                                     (Z=-0.529,P=0.596)。
                    本研究对既往列线图(Nomogram)模型的预测
                                                                  3  讨 论
                                                [9]
                效能进行了验证,结果显示张俐丽等 构建的Nomo⁃
                                               [8]
                gram 模型 AUC 为 0.607,付金平等 构建的 Nomo⁃                    本研究的主要发现:①首次以 SCLC 为独立研
                gram 模型 AUC 为 0.637(图 2)。DeLong 检验结果显             究对象建立肺部感染风险预测模型;②首次将声音
                示,SCLC⁃PIR 评分模型的 AUC 均显著高于张俐丽                     嘶哑纳入SCLC感染预测模型,揭示了SCLC特有的
                  [9]
                等 Nomogram 模型(Z=0.614,P < 0.001)和付金平              感染机制通路;③构建了评分系统而非列线图,临
                等 Nomogram 模型(Z=4.853,P < 0.001),提示其预             床实用性更强。
                 [8]
                测效能优于既往模型。张俐丽等 Nomogram 模型                            肺部感染是小细胞肺癌患者化疗期间常见的严
                                              [9]
                与付金平等 Nomogram模型预测效能未见明显差异                        重并发症,可显著影响化疗的连续性及患者预后                     [15] 。
                          [8]

