


Page 100 - 南京医科大学自然版
P. 100
第46卷第8期
               ·1206 ·                           南 京    医 科 大 学 学         报                        2026年8月


                    A   1.15        HR    LCI   UCI                 B   1.15        HR    LCI   UCI
                        (95%CI)  1.10  1.02  1.05  1.08  1.04  1.02  1.00  1.01  1.00  (95%CI)  1.10  1.05 1.05  1.07  1.05  1.01  1.03  1.05  1.03

                        1.05
                                                                        1.05
                                                                                   0.97
                                                                        1.00
                        1.00
                                   0.96
                                                                             0.94 0.95
                                                                                       0.95
                                0.94
                                                                                                 0.94
                                                                                                     0.92
                                       0.93
                        Hazard ratio  0.95 0.92  0.84  0.86  0.83  0.91  0.80  0.82 0.81  Hazard ratio  0.95  0.85  0.87  0.85  0.90  0.83  0.84  0.82
                                                                                              0.92
                                              0.90 0.91
                                                     0.90
                        0.90
                                                                        0.90 0.85
                        0.85 0.82
                                                                                          0.81
                                          0.82
                                                                        0.85
                        0.80
                        0.75                                            0.80
                                                                        0.75
                             1   2  3   4  5   6  7   8                       1  2   3  4   5  6   7  8
                                Subpopulations by median ABSI                   Subpopulations by median BRI
                    C   1.15        HR    LCI   UCI                 D   1.15        HR    LCI   UCI
                        (95%CI)  1.10  1.03 1.04 1.04 1.04  1.01  0.98 0.98  1.00  (95%CI)  1.10  1.05 1.05  1.07  1.05  1.01  1.03  1.05  1.03
                                                                        1.05
                        1.05
                                                                                    0.97
                                                                        1.00
                        1.00
                                                                                       0.95
                                                                             0.94 0.95
                             0.94 0.94 0.94
                                                                                                 0.94
                                       0.93
                                                                                                     0.92
                        Hazard ratio  0.95  0.85  0.84 0.84  0.91  0.78  0.78 0.79  Hazard ratio  0.95  0.85  0.87  0.85  0.90  0.92  0.84  0.82
                                                     0.89
                                              0.87 0.87
                        0.90 0.85
                                                                        0.90 0.85
                                                                                              0.83
                                          0.81
                                                                                          0.81
                        0.85
                                                                        0.85
                        0.80
                                                                        0.75
                        0.75                                            0.80
                             1   2  3   4  5   6  7   8                       1  2   3  4   5  6   7  8
                                Subpopulations by median BMI                    Subpopulations by median WHtR
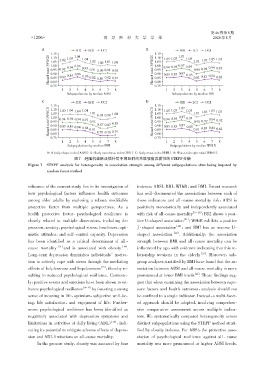
                       A:A body shape index(ABSI). B:Body roundness index(BRI). C:Body mass index(BMI). D:Waist⁃to⁃height ratio(WHtR).
                                   图7   经随机森林法插补后不同亚群间关联强度异质性的STEPP分析
              Figure 7  STEPP analysis for heterogeneity in association strength among different subpopulations after being imputed by
                       random forest method
              nificance of the current study lies in its investigation of  indexes:ABSI,BRI,WHtR,and BMI. Extant research
              how psychological factors influence health outcomes  has well⁃documented the associations between each of
              among older adults by exploring a robust,modifiable  these indicators and all⁃cause mortality risk:ABSI is
              protective factor from multiple perspectives. As a  positively monotonically and independently associated
                                                                                          [19-20]
              health protective factor,psychological resilience is  with risk of all⁃cause mortality  ;BRI shows a posi⁃
              closely related to multiple dimensions,including de⁃  tive U⁃shaped association [21] ;WHtR exhibits a positive
                                                                                  [20]
              pression,anxiety,psychological stress,loneliness,opti⁃  J ⁃ shaped association  ;and BMI has an inverse U ⁃
                                                                                 [22]
              mistic attitudes,and self⁃control capacity. Depression  shaped association  . Additionally,the association
              has been identified as a critical determinant of all ⁃  strength between BMI and all⁃cause mortality can be
              cause mortality [13] and is associated with obesity [14] .  influenced by age,with evidence indicating that this re⁃
                                                                                             [23]
              Long⁃term depression diminishes individuals’motiva⁃  lationship weakens in the elderly  . Moreover,sub⁃
              tion to actively cope with stress through the mediating  group analyses stratified by BMI have found that the as⁃
                                               [15]
              effects of helplessness and hopelessness  ,thereby re⁃  sociation between ABSI and all⁃cause mortality is more
              sulting in reduced psychological resilience. Converse⁃  pronounced at lower BMI levels [24] . These findings sug⁃
              ly,positive events and emotions have been shown to en⁃  gest that when examining the association between expo⁃
                                       [16-17]
              hance psychological resilience  by fostering a strong  sure factors and health outcomes,analysis should not
              sense of meaning in life,optimism,subjective well⁃be⁃  be confined to a single indicator. Instead,a multi⁃facet⁃
              ing,life satisfaction,and enjoyment of life. Further⁃  ed approach should be adopted,involving comprehen⁃
              more,psychological resilience has been identified as  sive comparative assessment across multiple indica⁃
              negatively associated with depression symptoms and  tors. We systematically compared heterogeneity across
                                                    [18]
              limitations in activities of daily living(ADL) ,indi⁃  distinct subpopulations using the STEPP method strati⁃
              cating its potential to mitigate adverse effects of depres⁃  fied by obesity indexes. For ABSI,the protective asso⁃
              sion and ADL limitations on all⁃cause mortality.  ciation of psychological resilience against all ⁃ cause
                  In the present study,obesity was assessed by four  mortality was more pronounced at higher ABSI levels.

