


Page 97 - 南京医科大学自然版
P. 97
第46卷第8期     陈芳怡,王     威,胡馨茹,等. 心理韧性与中国老年人全因死亡率关联强度的异质性:一项前瞻性队列
                  2026年8月                 研究[J]. 南京医科大学学报(自然科学版),2026,46(8):1197-1210                   ·1203 ·


               (续表1)
                                                                    Psychological resilience          Standardized
                        Variable           All(n=7 481)                                           P
                                                              Low(n=3 214)       High(n=4267)          difference
                BMI(kg/m ,x ± s)           21.05 ± 4.370      20.64 ± 4.530      21.37 ± 4.220  <0.001   0.167
                        2
                Psychological resilience(x ± s)  13.99 ± 3.020  11.17 ± 1.820    16.11 ± 1.740  <0.001   2.777
                Activity score[M(P25,P75)]  0 010.0(5.0,15.0)  0 008.0(4.0,12.0)  0 012.0(8.0,16.0)  <0.001  0.564
                DD score[M(P25,P75)]    0 004.0(3.0,6.0)  0 004.0(2.0,5.0)   0 005.0(3.0,6.0)   <0.001   0.454
                BADL score(x ± s)          17.23 ± 1.980      16.85 ± 2.450      17.52 ± 1.470  <0.001   0.332
                Follow⁃up[d,M(P25,P75)]  1 408.0(858.0,2 482.0)  1 142.0(696.5,2 236.0) 1 672.0(945.0,2 514.0) <0.001  0.237
                   *Category 1:staff of farming/forestry/animal husbandry/side ⁃ line production/fishery;Category 2:workers/teachers/doctors/military/government
                workers/businessmen;Category 3:other. BADL score:base activity of daily living score;BMI:body mass index;DD score:diversity of dietary score;
                MCC:multiple chronic conditions.

                ience group(all P < 0.05,Figure 4).                    2.50
                                                                      (95% CI)
                2.3  STEPP analysis based on obesity indices           2.25
                                                                       2.00
                    ABSI,BRI,WHtR,and BMI were used as covari⁃         1.75
                                                                      HR of mortality  0.75
                ates to split subpopulations(Table 2). For ABSI,the    1.50
                                                                       1.25
                HR for high versus low psychological resilience        1.00
                showed a clear downward trend as the median ABSI in⁃   0.50
                                                                             2
                creased,with statistically significant heterogeneity   0.25  χ =238.7 P < 0.001
                                                                       0.00
                among subpopulations(P < 0.001). From subpopula⁃
                                                                           4 5 6 7 8 9 10 11 12 13 14 15 16 17 18 19 20
                tions 5 to 8,the HRs were the lowest and their changes              Psychological resilience
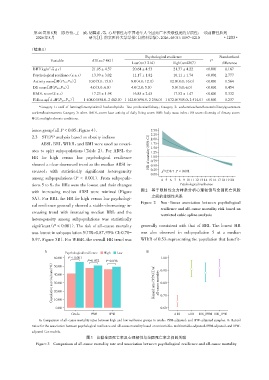
                                                                  图 2  基于限制性立方样条分析心理韧性与全因死亡风险
                with increasing median ABSI were minimal(Figure
                                                                       之间的非线性关系
                5A). For BRI,the HR for high versus low psychologi⁃
                                                                  Figure 2  Non ⁃ linear association between psychological
                cal resilience generally showed a stable⁃decreasing⁃in⁃
                                                                           resilience and all⁃cause mortality risk based on
                creasing trend with increasing median BRI,and the
                                                                           restricted cubic spline analysis
                heterogeneity among subpopulations was statistically
                significant(P < 0.001). The risk of all⁃cause mortality  generally consistent with that of BRI. The lowest HR
                was lowest in subpopulation 5(HR=0.87,95% CI:0.78-  was also observed in subpopulation 5 at a median
                0.97,Figure 5B). For WHtR,the overall HR trend was  WHtR of 0.53,representing the population that benefit⁃

                      A        Psychological resilience  High  Low   B
                          60.00  P < 0.001                                 1.00
                                         P=0.032  P=0.038
                         (%)  50.00                                     of (95%CI)  0.90
                         Cumulative survival rate  30.00                Hazard ratio  all⁃cause mortality  0.80
                          40.00


                          20.00
                                                                           0.70
                          10.00
                           0.00                                            0.60
                                  Crude    PSM     IPW                           cHR    aHR  HR_PSM HR_IPW
                   A:Comparison of all⁃cause mortality rates between high and low resilience groups in crude,PSM⁃adjusted,and IPW⁃adjusted samples. B:Hazard
                ratios for the association between psychological resilience and all⁃cause mortality based on univariable,multivariable⁃adjusted,PSM⁃adjusted,and IPW⁃
                adjusted Cox models.
                                         图3 比较全因死亡率及心理韧性与全因死亡率之间的关联
                  Figure 3  Comparison of all⁃cause mortality rate and association between psychological resilience and all⁃cause mortality

