


Page 93 - 南京医科大学自然版
P. 93
第46卷第8期     陈芳怡,王     威,胡馨茹,等. 心理韧性与中国老年人全因死亡率关联强度的异质性:一项前瞻性队列
                  2026年8月                 研究[J]. 南京医科大学学报(自然科学版),2026,46(8):1197-1210                   ·1199 ·


                within this observation window. Follow ⁃ up continued  No patients or members of the public were in⁃
                from baseline until participant death,the last complet⁃  volved in the design,conduct,reporting or dissemina⁃
                ed follow⁃up visit,or the end of the observation period,  tion plans of this research. As a secondary analysis of
                whichever occurred first. Of the 9 765 participants sur⁃  legally obtained public data,this study utilized anony⁃
                veyed in 2011- 2012,we excluded those aged <65    mized information without the use of biological sam⁃
                years(n=86),those with missing baseline psychologi⁃  ples. This study was approved by the Research Ethics
                cal resilience data(n=1 479),those lost to follow⁃up in  Committee of Peking University (IRB00001052 ⁃
                2014(n=651)or 2017- 2018(n=40),and those who      13074). Written informed consent was obtained from
                died prior to the baseline assessment(n=28). Conse⁃  all participants or their proxy respondents.
                quently,7 481 participants were included in the final  1.2  Methods
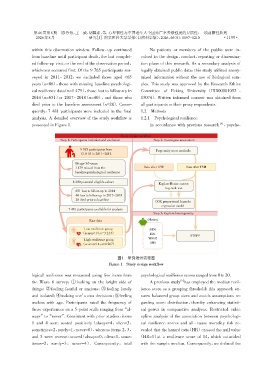
                analysis. A detailed overview of the study workflow is  1.2.1 Psychological resilience
                                                                                                      [9]
                presented in Figure 1.                                In accordance with previous research  ,psycho⁃

                                                         Study design workflow
                             Step 1:Participants inclusion and exclusion  Step 2:Investigate association

                                      9 765 participants from            Propensity score methods
                                      CLHLS in 2011-2012

                                    86 age<65 years
                                    1 479 missed from the          Data after IPW      Data after PSM
                                    baseline psychological resilience

                                   8 200 potential eligible cohort
                                                                          Kaplan⁃Merier curves
                                                                             Log⁃rank test
                                    651 loss to follow⁃up in 2014
                                    40 loss to follow⁃up in 2017-2018
                                    28 died prior to baseline
                                                                         COX proportional hazards
                                                                            regression model
                                 7 481 participants available for analysis
                                                                        Step 3:Explore heterogeneity
                                          Raw data                   Obesity

                                        Low resilience group          ABSI
                                       (scores<14,n=3 214)            BRI
                                                                                         STEPP
                                                                      WHtR
                                        High resilience group
                                       (scores≥14,n=4 267)            BMI

                                                       图1 研究设计流程图
                                                   Figure 1 Study design workflow

                logical resilience was measured using five items from  psychological resilience scores ranged from 0 to 20.
                                                                                    [9]
                the Wave 6 survey:① looking on the bright side of     A previous study has employed the median resil⁃
                things;② feeling fearful or anxious;③ feeling lonely  ience score as a grouping threshold;this approach en⁃
                and isolated;④making one’s own decisions;⑤feeling  sures balanced group sizes and avoids assumptions re⁃
                useless with age. Participants rated the frequency of  garding score distribution,thereby enhancing statisti⁃
                these experiences on a 5⁃point scale ranging from“al⁃  cal power in comparative analyses. Restricted cubic
                ways”to“never”. Consistent with prior studies,items  spline analysis of the association between psychologi⁃
                1 and 4 were scored positively(always=4,often=3,  cal resilience scores and all ⁃ cause mortality risk re⁃
                sometimes=2,rarely=1,never=0),whereas items 2,3,  vealed that the hazard ratio(HR)crossed the null value

                and 5 were reverse ⁃ scored(always=0,often=1,some⁃  (HR=1)at a resilience score of 14,which coincided
                times=2,rarely=3,never=4). Consequently,total     with the sample median. Consequently,we defined the

