


Page 98 - 南京医科大学自然版
P. 98
第46卷第8期
               ·1204 ·                           南 京    医 科 大 学 学         报                        2026年8月


               A      A:Kaplan⁃Meier Curve before PSM           B     B:Kaplan⁃Meier Curve before PSM
                   1.0                                             1.0
                  Survival probability 0.9  Psychological resilience  Survival probability 0.9  Psychological resilience
                                                                   0.8
                   0.8
                   0.7
                                                                   0.7
                   0.6
                                                                   0.6
                   0.5
                                                                   0.5
                                                                   0.4
                   0.4
                   0.3
                                                                   0.2
                   0.2
                                                                         High
                         High
                   0.1   Low                                       0.3   Low
                                                                   0.1
                   0.0  log⁃rank P < 0.000 1                       0.0  log⁃rank P=0.003 5
                        0  250  500  750  1 000  1 250  1 500  1 750  2 000  2 250  2 500  2 750  3 000  0  250  500  750  1 000  1 250  1 500  1 750  2 000  2 250  2 500 2 750  3 000
                                      Time(day)                                       Time(day)
                                       C
                                              C:Kaplan⁃Meier Curve before PSM
                                           1.0
                                          Survival probability 0.9  Psychological resilience
                                           0.8
                                           0.7
                                           0.6
                                           0.5
                                           0.4
                                           0.3
                                           0.2
                                                 High
                                           0.1   Low
                                                log⁃rank P < 0.000 1
                                           0.0
                                                0  250  500  750 1 000  1 250  1 500  1 750  2 000  2 250  2 500  2 750  3 000
                                                              Time(day)
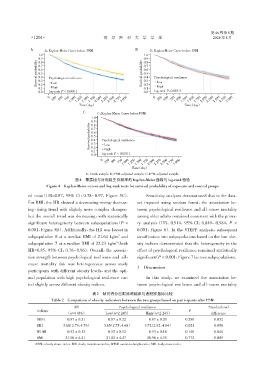
                                         A:Crude sample. B:PSM⁃adjusted sample. C:IPW⁃adjusted sample.
                                    图4 暴露组与对照组生存概率的Kaplan⁃Meier曲线与log⁃rank检验
                      Figure 4 Kaplan⁃Meier curves and log⁃rank tests for survival probability of exposure and control groups
              ed most(HR=0.87,95% CI:0.78- 0.97,Figure 5C).          Sensitivity analyses demonstrated that in the data⁃
              For BMI,the HR showed a decreasing⁃rising⁃decreas⁃  set imputed using random forest,the association be⁃
              ing⁃rising trend with slightly more complex changes,  tween psychological resilience and all⁃cause mortality
              but the overall trend was decreasing,with statistically  among older adults remained consistent with the prima⁃
              significant heterogeneity between subpopulations(P <  ry analysis(HR:0.914,95% CI:0.849- 0.984,P <
              0.001,Figure 5D). Additionally,the HR was lowest in  0.001,Figure 6). In the STEPP analysis,subsequent
                                                        2
              subpopulation 6 at a median BMI of 21.64 kg/m and  stratification into subpopulations based on the four obe⁃
                                                       2
              subpopulation 7 at a median BMI of 22.23 kg/m(both  sity indices demonstrated that the heterogeneity in the
              HR=0.85,95% CI:0.76- 0.96). Overall,the associa⁃  effect of psychological resilience remained statistically
              tion strength between psychological resilience and all⁃  significant(P < 0.001,Figure 7)across subpopulations.
              cause mortality risk was heterogeneous across study
                                                                3  Discussion
              participants with different obesity levels,and the opti⁃
              mal population with high psychological resilience var⁃  In this study,we examined the association be⁃
              ied slightly across different obesity indices.    tween psychological resilience and all⁃cause mortality
                                            表2  倾向得分匹配后两组参与者肥胖指标比较
                         Table 2  Comparison of obesity indicators between the two groups based on participants after PSM
                                   All                  Psychological resilience                 Standardized
                  Indictor                                                              P
                                (n=4 486)         Low(n=2 243)      High(n=2 243)                 difference
                  ABSI          0.87 ± 0.21        0.87 ± 0.22        0.87 ± 0.20      0.280        0.032
                  BRI         3.68(2.79,4.76)    3.65(2.75,4.68)    3.72(2.82,4.84)    0.021        0.058
                  WHtR          0.52 ± 0.13        0.52 ± 0.12        0.53 ± 0.14      0.140        0.044
                  BMI          21.00 ± 4.410      21.02 ± 4.470      20.98 ± 4.350     0.772        0.009
                 ABSI:a body shape index;BRI:body roundness index;WHtR:waist⁃to⁃height⁃ratio;BMI:body mass index.

