


Page 127 - 南京医科大学自然版
P. 127
第45卷第8期       李  沁,丁志颖,宗晴晴,等. 基于超声构建的列线图模型在鉴别非平行位乳腺小肿块良恶性中的
                  2025年8月               应用价值[J]. 南京医科大学学报(自然科学版),2025,45(8):1178-1185                   ·1183 ·


                                              0    10   20   30   40    50   60   70    80   90   100
                            Points

                            Age
                                             20  25  30  35  40  45  50  55  60  65  70  75  80  85  90
                                                            Not circumscribed
                            Margin
                                             Circumscribed
                                                      Intermediate
                            Elasticity
                                             Soft                Hard
                                                                 4B
                            US⁃BI⁃RADS
                                             4A
                            Total points
                                              0   20   40   60   80  100  120  140  160  180  200  220
                            Risk of event
                                                              0.1  0.2 0.30.40.50.6 0.7 0.8  0.9
                   Nomogram to predict the malignancy in patients with small BI⁃RADS 4A,4B breast lesions that featured non⁃parallel orientation on ultrasound.
                The nomogram was developed in the training set,which incorporated age,margin,elasticity and US⁃BI⁃RADS. The total points were calculated and pro⁃
                jected at the bottom scale indicate the malignancy risk.
                                                  图1   基于训练集构建的列线图模型
                                    Figure 1 Nomogram to predict the malignancy based on the training set


                  A                            B                                 C
                      1.0                                                            0.4             Nomogram
                      0.8                          0.8                               0.3             All
                                                                                                     None
                                                   0.6
                     Sensitivity  0.6  AUC:0.846   Actrual probability  0.4  Apparrent  Net benefit  0.2
                                                                                     0.1
                      0.4
                                                   0.2
                                                                 Bias⁃corrected
                                                                 Ideal                0
                      0.2                            0
                                                                                       00  0.2  0.4  0.6  0.8  1.0
                                                      00  0.2  0.4  0.6  0.8                High risk threshold
                       0
                                                          Predicted Probability
                        00  0.2 0.4 0.6 0.8 1.0
                                                       B=400      Mean absolute        1∶100 1∶4 2∶3  3∶2 4∶1 100∶1
                              1-Specificity
                                                    repetitions,boot  error=0.017(n=196)     Cost:benefit ratio
                  D                            E                                 F
                      1.0                                                            0.4             Nomogram
                      0.8                           0.6                              0.3             All
                                                                                                     None
                     Sensitivity  0.6  AUC:0.798   Actrual probability 0.8  Apparrent  Net bbenefit  0.2
                                                    0.4
                                                                                     0.1
                      0.4
                                                    0.2
                                                                 Ideal
                      0.2                                        Bias⁃corrected       0
                                                     0                                 00  0.2  0.4  0.6  0.8  1.0
                                                      0  0.2  0.4  0.6  0.8                 High risk threshold
                       0
                                                          Predicted Probability
                        00  0.2 0.4 0.6 0.8 1.0
                                                       B=400      Mean absolute        1∶100 1∶4 2∶3  3∶2 4∶1 100∶1
                              1-Specificity
                                                    repetitions,boot  error=0.038(n=73)      Cost:benefit ratio
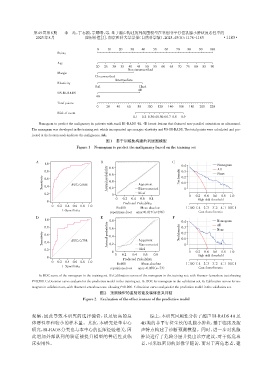
                   A:ROC curve of the nomogram in the training set. B:Calibration curves of the nomogram in the training set,with Hosmer⁃Lemeshow test showing
                P=0.589. C:Decision curve analysis for the prediction model in the training set. D:ROC for nomogram in the validation set. E:Calibration curves for no⁃
                mogram in validation set,with Hosmer⁃Lemeshow tests showing P=0.206. F:Decision curve analysis for the prediction model in the validation set.
                                               图2   预测模型的鉴别效能及临床意义评估
                                       Figure 2  Evaluation of the effectiveness of the predictive model
                观察,因此导致本研究的选择偏倚,以及较高的总                                综上,本研究回顾性分析了超声BI⁃RADS 4A及
                体恶性率和较小的样本量。其次,本研究是单中心                            4B类的非平行位生长的乳腺小肿块,基于临床及超
                研究,BI⁃RADS分类也与本中心的医师经验相关,因                        声特点构建了诊断预测模型。同时,进一步对乳腺
                此增加外部队列的验证能提升模型的普适性及临                             肿块进行了危险分层并提出诊疗建议,对于低危患
                床实用性。                                             者,可采取密切的影像学随访,而对于高危患者,建

