


Page 80 - 南京医科大学自然版
P. 80
第45卷第8期
               ·1136 ·                           南 京    医 科 大 学 学         报                        2025年8月


                                                                密,其他全局指标之间的差异无统计学意义(P >
                                                                0.05,表2)。
                                                                     节点指标:PD 组右侧梭状回的 DC 值显著低于
                                                                NC 组(t=3.32,P < 0.001),其余节点指标未能通过
                                                                FDR校正,差异无统计学意义。
                                                                2.3  代谢脑网络连接值
                                   A                       B
                      18
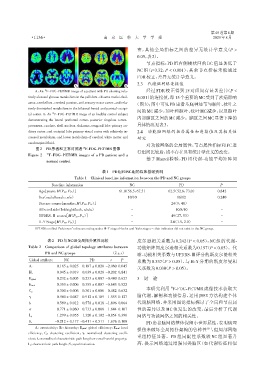
                 A:An F⁃FDG⁃PET/MR image of a patient with PD showing rela⁃  经过 FDR 校正得到 15 对组间有显著差异(P <
              tively elevated glucose metabolism in the pallidum,chiasma nuclei,thal⁃  0.001)的连接值,即15个重要的MC受到了疾病影响
              amus,cerebellum,cerebral pontine,and sensory⁃motor cortex,and rela⁃
                                                               (图3);图中可见PD患者基底神经节与颞叶、枕叶之
              tively diminished metabolism in the bilateral frontal and parietal⁃occipi⁃
                                                                间的MC减少,顶叶和额叶、枕叶MC减少,以及额叶
                         18
              tal cortex. B:An F⁃FDG⁃PET/MR image of an healthy control subject
                                                                内部脑区之间的MC减少。脑区之间MC显著下降的
              demonstrating the lateral prefrontal cortex,posterior cingulate cortex,
                                                                具体情况见表3。
              precuneus,caudate,shell nucleus,thalamus,temporal lobe primary au⁃
              ditory cortex,and occipital lobe primary visual cortex with relatively in⁃  2.4  功能脑网络的拓扑属性和连接值及其相关性
              creased metabolism,and lower metabolism of cerebral white matter and  研究
              cerebrospinal fluid.
                                                                     对功能网络的全局属性、节点属性指标和FC进
                 图2 PD患者和正常对照者 F⁃FDG⁃PET/MR图像
                                       18
                                                                行组间比较后,均不存在具有统计学意义的改变。
              Figure 2  18 F⁃FDG⁃PET/MR images of a PD patient and a
                                                                     基于 Mantel 检验,PD 组代谢⁃功能平均矩阵间
                       normal control
                                                表1 PD组和NC组的临床基线资料
                                   Table 1 Clinical baseline information between the PD and NC groups
                         Baseline information                NC                     PD                 P
                   Age[years,M(P25,P75)]                61.0(56.5,67.5)        62.5(52.8,73.0)       0.842
                   Sex(male/female,n/n)                     10/10                  16/12             0.240
                   Disease course[months,M(P25,P75)]          -                 24(9,48)00.            -
                   Affected side(left/right/both,n/n/n)       -                   10/8/10              -
                   UPDRS⁃Ⅲ scores[M(P25,P75)]                 -                 49(27,53)0.            -
                   H⁃Y Stage[M(P25,P75)]                      -                 2.0(1.5,2.0).          -

                 UPDRS:unified Parkinson’s disease rating scale;H⁃Y stage:Hoehn and Yahr stage;-:this indicator did not exist in the NC group.

                       表2 PD与NC组全局拓扑属性比较                        皮尔逊相关系数为 0.242(P < 0.05),NC 组的代谢⁃
              Table 2  Comparison of global topology attributes between  功能矩阵间皮尔逊相关系数为0.197(P < 0.05)。代
                      PD and NC groups              (x ± s)     谢⁃功能相关系数与UPDRS⁃Ⅲ评分的斯皮尔曼相关

              Global attribute  NC        PD        t    P      系数为 0.337(P > 0.05),与 H⁃Y 分期的斯皮尔曼相
                           0.165 ± 0.025 0.187 ± 0.028  -2.060 0.045
                                                                关系数为0.030(P > 0.05)。
              Ar
                           0.045 ± 0.019 0.039 ± 0.020  -0.202 0.841
              Hr
                           0.232 ± 0.005 0.233 ± 0.007  -0.480 0.627  讨 论
              Eglobal                                           3
                           0.353 ± 0.006 0.355 ± 0.007  -0.645 0.522
              Elocal
                                                                     本研究利用 F⁃FDG⁃PET/MR 成像技术获取大
                                                                                18
                           0.300 ± 0.006 0.301 ± 0.006  -0.482 0.632
              Cp
                                                                脑代谢、解剖和功能信息,运用 JSSE 方法构建个体
              γ            0.960 ± 0.087 0.912 ± 0.109  1.555 0.127
                                                                代谢脑网络,并采用图论指标探讨了全局和节点属
              λ            0.569 ± 0.012 0.578 ± 0.018  -1.896 0.064
              σ            0.771 ± 0.060 0.733 ± 0.088  1.644 0.107  性的差异以及 MC 值发生的改变,最后分析了代谢
                           1.299 ± 0.055 1.320 ± 0.102  -0.854 0.398
              Lp                                                网络与功能网络之间的相关性。
                          -0.212 ± 0.117 -0.411 ± 0.511  1.676 0.100
              Sr                                                     PD患者脑网络整体保留小世界属性,表明病理
                 Ar:assortativity;Hr:hierarchy;Eglobal:global efficiency;Elocal:local           [21]
                                                                损伤未破坏全局拓扑架构的鲁棒性                    ,但局部网络
              efficiency;Cp:clustering coefficient;γ:normalized clustering coeffi⁃
                                                                重组特征显著。PD 组同配性系数较 NC 组显著升
              cient;λ:normalized characteristic path length;σ:small⁃world property;
                                                                高,提示网络通过增强同类脑区(如代谢特征相似
              Lp:characteristic path length;Sr:synchronization.

