


Page 126 - 南京医科大学自然版
P. 126
第46卷第6期
               ·908  ·                           南 京    医 科 大 学 学         报                        2026年6月


                                    A                        B                       C                       D


                                    E                        F                       G                       H
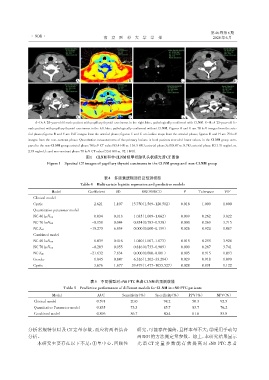
                 A-D:A 29⁃year⁃old female patient with papillary thyroid carcinoma in the right lobe,pathologically confirmed with CLNM. E-H:A 25⁃year⁃old fe⁃
              male patient with papillary thyroid carcinoma in the left lobe,pathologically confirmed without CLNM. Figures A and E are 70 keV images from the arte⁃
              rial phase;figures B and F are Zeff images from the arterial phase;figures C and G are iodine maps from the arterial phase;figures D and H are 70 keV
              images from the non⁃contrast phase. Quantitative measurements of the primary lesions in both patients revealed lower values in the CLNM group com⁃
              pared to the non⁃CLNM group:arterial phase 70 keV CT value(93.4 HU vs. 116.3 HU),arterial phase Zeff(8.07 vs. 8.78),arterial phase IC(1.31 mg/mL vs.
              2.93 mg/mL),and non⁃contrast phase 70 keV CT value(53.6 HU vs. 92.1 HU).
                                         图1  CLNM和非CLNM组甲状腺乳头状癌光谱CT图像
                       Figure 1 Spectral CT images of papillary thyroid carcinoma in the CLNM group and non⁃CLNM group


                                                 表4 多因素逻辑回归及预测模型
                                      Table 4 Multivariate logistic regression and predictive models
                         Model            Coefficient  SD         OR(95%CI)           P      Tolerance   VIF
                Clinical model
                Cystic                     002.621    1.107   13.750(1.569-120.502)  0.018    1.000     1.000
                Quantitative parameter model
                                           000.034    0.013   01.035(1.009-1.062)    0.009    0.262     3.822
                NC 40 keVHU
                                           0-0.158    0.044   00.854(0.783-0.930)    0.000    0.269     3.715
                NC 70 keVHU
                NC Zeff                    -15.273    6.854   00.000(0.000-0.159)    0.026    0.920     1.087
                Combined model
                                           000.039    0.016   01.040(1.007,1.073)    0.015    0.255     3.926
                NC 40 keVHU
                                           0-0.203    0.055   00.816(0.733-0.909)    0.000    0.267     3.741
                NC 70 keVHU
                                           -21.632    7.634   00.000(0.000,0.001)    0.005    0.915     1.093
                NC Zeff
                Gender                     001.845    0.847   06.326(1.202-33.284)   0.029    0.918     1.090
                Cystic                     003.676    1.677   39.479(1.477-1055.527)  0.028   0.891     1.122


                                           表5  不同模型对cN0 PTC患者CLNM的预测效能
                              Table 5 Predictive performance of different models for CLNM in cN0 PTC patients

                         Model                AUC         Sensitivity(%)  Specificity(%)  PPV(%)     NPV(%)
                 Clinical model               0.591          20.0            98.2         50.3         92.5
                 Quantitative Parameter model  0.835         73.3            85.7         83.7         76.2
                 Combined model               0.896          86.7            80.4         81.6         85.8


              分析常规特征以及 CT 定量参数,而应将两者结合                          研究,可能存在偏倚,且样本量不大;②采用手动勾
              分析。                                               画 ROI 的方法测定量参数。综上,本研究结果显示
                  本研究主要存在以下不足:①单中心、回顾性                          光 谱 CT 定 量 参 数 能 有 效 提 高 对 cN0 PTC 患 者

