


Page 92 - 南京医科大学自然版
P. 92
第46卷第9期
               ·1362 ·                           南 京    医 科 大 学 学         报                        2026年9月


                                            0    10   20    30   40   50    60   70   80    90   100
                          Points
                          RSAD
                                            0      0.5     1      1.5     2      2.5      3      3.5
                                                3      5
                          PI⁃RADS score
                                            2      4
                                                    2
                          Number of lesions
                                            1               3
                          Suspicious for                     Yes
                          capsular invasion
                                            No
                          Suspicious for         No
                          lymph nodemetastasis
                                           Yes
                          Total points
                                            0     20   40    60    80    100   120   140   160   180
                          Risk
                                                  0.1  0.3 0.5  0.8 0.9     0.99
                                     Points:standardized score;Total points:total score;Risk:risk of positive margin.
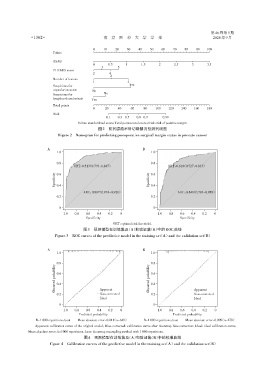
                                              图2 前列腺癌术后切缘情况预测列线图
                            Figure 2 Nomogram for predicting postoperative surgical margin status in prostate cancer


                       A                                           B
                           1.0                                         1.0

                           0.8                                         0.8
                                   ORT:0.513(0.793,0.847)                      ORT:0.610(0.727,0.833)
                          Specificity  0.6                            Specificity  0.6

                           0.4
                                                                       0.4
                                        AUC:0.897(0.874-0.921)                     AUC:0.841(0.793-0.888)
                           0.2                                         0.2


                            0                                           0
                              1.0  0.8   0.6  0.4  0.2   0                1.0  0.8  0.6  0.4  0.2   0
                                         Specificity                                Specificity
                                                     ORT:optimal risk threshold.
                                        图3 预测模型在训练集及(A)和验证集(B)中的ROC曲线
                          Figure 3 ROC curves of the predictive model in the training set(A)and the validation set(B)


                       A                                           B
                           1.0                                         1.0

                          Observed probability 0.8                    Observed probability 0.8
                                                                       0.6
                           0.6

                           0.4
                                                                       0.4
                                               Bias⁃corrected
                                                                                           Bias⁃corrected
                           0.2                 Apparent                0.2                 Apparent
                                               Ideal                                       Ideal
                            0                                           0
                              1.0  0.8   0.6  0.4  0.2   0                1.0  0.8  0.6  0.4   0.2  0
                                     Predicted probability                       Predicted probability
                  B=1 000 repetitions,boot  Mean absoiute error=0.011(n=649)  B=1 000 repetitions,boot  Mean absoiute error=0.009(n=278)
                 Apparent:calibration curve of the original model;Bias⁃corrected:calibration curve after Bootstrap bias correction;Ideal:ideal calibration curve;
              Mean absolute error;B=1000 repetitions,boot:Bootstrap resampling method with 1 000 repetitions.
                                        图4  预测模型在训练集及(A)和验证集(B)中的校准曲线
                        Figure 4  Calibration curves of the predictive model in the training set(A)and the validation set(B)

