Page 10 - 南京医科大学学报自然科学版
P. 10

第44卷第3期
               ·300 ·                          南   京 医 科       大 学      学 报                        2024年3月


                   60                              1.5% SAB     组、1.0%SAB组的创面面积小于其他组(P < 0.05);第
                  ( μg/mL)  40                     0.5% SAB     14 天时,各组创面面积均缩小,0.5%SAB 组、1.0%
                                                   1.0% SAB
                                                                SAB 组的创面面积小于其他组(P < 0.05),其中
                                                   0% SAB
                  Cumulative release  20                        2.4  在第 7、14 天时,各组创面组织均有 ROS 表达
                                                                1.0%SAB组的创面愈合最好。
                                                                     创面组织ROS表达水平


                                                                5)。第7天时,1.0%SAB组ROS表达水平显著低于其
                    0                                           (图 4);对各组 ROS 的表达水平进行定量分析(图
                     0  10  20  30  40  50  60  70
                                Time(h)                         他组(P < 0.001);第14天时,1.0%SAB组ROS表达水
              图2   不同规格SAB⁃海藻酸钠⁃明胶皮肤支架的SAB体外释
                                                                平显著低于空白对照组、凡士林纱布组、0%SAB组及
                   放曲线                                          0.5% SAB 组(P < 0.01),1.0%SAB 组和 1.5%SAB 组
              Figure 2  In vitro release curves of SAB⁃sodium alginate⁃  ROS表达水平差异无统计学意义(P=0.136)。
                       gelatin skin scaffolds with different specifications
                                                                2.5  创面组织 SOD、GSH⁃PX、CAT 及 MDA 的表达
              2.3  创面修复                                         水平
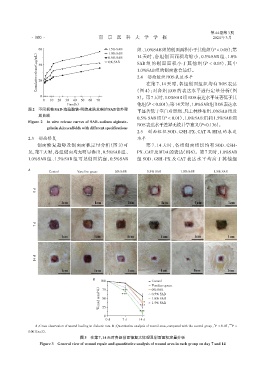
                  创面修复趋势及创面面积定量分析(图 3)可                              第 7、14 天时,各组创面组织均有 SOD、GSH⁃
              见,第7天时,各组创面均无明显渗出,0.5%SAB组、                       PX、CAT及MDA的表达(图6)。第7天时,1.0%SAB
              1.0%SAB 组、1.5%SAB 组可见创面结痂,0.5%SAB                 组 SOD、GSH⁃PX 及 CAT 表达水平均高于其他组


              A
                        Control      Vaselinc gauze   0% SAB         0.5% SAB       1.0% SAB        1.5% SAB


                 d
                 0


                 d
                 7


                 d
                 14


                                            B
                                               100                     Control
                                                                       Vaselinc gauze
                                               ( % )  75  ***          0% SAB
                                                          ***
                                               Wound area  50     *** *  1.0% SAB
                                                                       0.5% SAB
                                                                       1.5% SAB
                                                25
                                                                 ***
                                                 0
                                                  0 d     7 d    14 d
                                                                                                           ***
                                                                                                    *
                 A:Gross observation of wound healing in diabetic rats. B:Quantitative analysis of wound area,compared with the control group,P < 0.05, P <
              0.001(n=3).
                                      图3 在第7、14天时各组创面修复大体观及创面面积定量分析
                   Figure 3  General view of wound repair and quantitative analysis of wound area in each group on day 7 and 14
   5   6   7   8   9   10   11   12   13   14   15