Page 87 - 南京医科大学学报自然科学版
P. 87

第44卷第3期         刘志鹏,降建新,吴琪炜,等. 基于多序列MRI影像组学与深度迁移学习特征的脑胶质瘤分级
                  2024年3月                预测研究[J]. 南京医科大学学报(自然科学版),2024,44(3):372-379                    ·377 ·


                  A                            B
                                                             mRMR             RF⁃RFE           SVM⁃RFE
                                                         T1
                             Validation
                                                         T2
                                                                                                           0.960
                       SVM 0.957 0.958 0.996             T1c
                                           0.980
                                                        Flair
                        LR 0.965 0.960 0.995
                                                       T1+T2                                               0.900
                                           0.960      T1+T1c
                        RF 0.949 0.967 0.957
                                                     T1+Flair
                                           0.940      T2+T1c                                               0.840
                    XGBoost 0.951 0.956 0.965
                                                     T2+Flair
                        DT 0.905 0.923 0.878  0.920  T1c+Flair
                                                                                                           0.780
                                                   T1+T2+T1c
                       KNN 0.987 0.980 0.979
                                           0.900   T1+T2+Flair
                                                  T1+T1c+Flair
                        NB 0.947 0.923 0.927                                                               0.720
                                                  T2+T1c+Flair
                                           0.880                         0.976    0.988    0.932    0.920
                         mRMR RF⁃RFE            T1+T2+T1c+Flair  AUC  ACC      SEN      SPE       YI
                                SVM⁃RFE
                            ( Positive label: )  0.8                   ( Positive label: )  0.8
                         C  1  1.0                                  D  1  1.0


                                                                        0.6
                             0.6
                            True positive rate  0.4  ROC fold 0(AUC=0.991)  True positive rate  0.4  ROC(AUC=0.986)
                                             ROC fold 1(AUC=0.998)
                                             ROC fold 2(AUC=0.993)
                                             ROC fold 3(AUC=1.000)
                                             ROC fold 4(AUC=0.998)
                             0.2
                                                                        0.2
                                             Chance
                                             Mean ROC(AUC=0.996 ± 0.004)
                              0
                                               0.6
                                 0   0.2  0.4  ± 1 std.dev.  0.8  1.0    0  0   0.2   0.4  0.6  0.8  1.0
                                  False positive rate(Positive label:1)      False positive rate(Positive label:1)
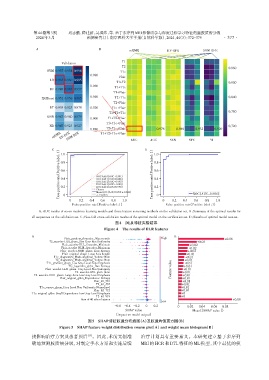
                   A:AUC results of seven machine learning models and three feature screening methods on the validation set. B:Summary of the optimal results for
                all sequences on the validation set. C:Five⁃fold cross⁃validation results of the optimal model on the verification set. D:Results of optimal model test set.
                                                      图4 DLR特征实验结果
                                                 Figure 4 The results of DLR features
                A                                                                B
                               Flair_gradient_firstorder_90percentile      High                          +0.08
                        T2_wavelet⁃LLH_glszm_Size Zone Non Uniformity                       +0.03
                              Flair_wavelet⁃HLL_firstorder_Minimum                       +0.02
                             Flair_wavelet⁃HLH_firstorder_Maximum                       +0.02
                             Flair_wavelet⁃HHH_glszm_Zone Entropy                       +0.02
                              Flair_original_shape_Least Axis Length                   +0.01
                          T1c_diagnostics_Mask⁃orighinal_Volume Num                    +0.01
                           T2_diagnostics_Mask⁃orighinal_Volume Num                   +0.01
                       T1c_gradient_glszm_Low Gray Level Zone Emphasis                +0.01
                                 T1c_logarithm_glrlm_Run Entropy                      +0.01
                      Flair_wavelet⁃LLH_glszm_Gray Level Non Uniformity         Feature value  +0.01
                                    T2_wavelet⁃LHL_glcm_ldmn                         +0.01
                 T2_wavelet⁃HHH_glszm_Large Area Low Gray Level Emphasis             +0.01
                             Flair_original_gldm_Dependence Entropy                  +0.01
                                            Flair_dtl_981                            +0.01
                                             T2_dtl_467                              +0.01
                   T1c_square_glszm_Gray Level Non Uniformity Normalized             +0.01
                                            Flair_dtl_712                            +0.01
                T1c_original_gldm_Small Dependence Low Gray Level Emphasis           +0
                                             T2_dtl_919                              +0
                                      Sum of 40 other features                                              +0.09
                                                                           Low
                                                      -0.6  -0.4 -0.2  0  0.2      0   0.02  0.04  0.06  0.08
                                                           SHAP value                     Mean(SHAP value)
                                                      (impact on model output)
                                          图5 SHAP特征权重分布蜂图(A)及权重均值直方图(B)
                            Figure 5  SHAP feature weight distribution swarm plot(A)and weight mean histogram(B)
                接影响治疗方案及患者预后             [13] 。因此,术前无创准           治疗计划具有重要意义。本研究建立基于多序列
                确地预测胶质瘤分级,对制定手术方案和实施后续                            MRI 的 HCR 和 DTL 特征的 ML 模型,其中最优的模
   82   83   84   85   86   87   88   89   90   91   92