
Page 82 - 南京医科大学自然版
P. 82
第44卷第4期
·520 · 南 京 医 科 大 学 学 报 2024年4月
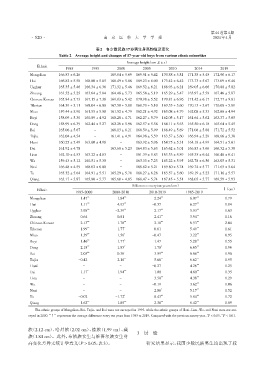
表2 各少数民族17岁男生身高均值及变化
Table 2 Average height and changes of 17⁃year⁃old boys from various ethnic minorities
Average height(cm,x ± s)
Ethnic
1985 1995 2000 2005 2010 2014 2019
Mongolian 166.83 ± 6.26 - 169.04 ± 5.69 169.51 ± 5.42 170.88 ± 5.81 171.38 ± 5.45 172.90 ± 6.17
Hui 166.82 ± 5.58 168.80 ± 5.85 168.49 ± 5.66 169.23 ± 6.00 173.42 ± 6.42 173.73 ± 5.67 173.09 ± 6.46
Uyghur 165.35 ± 5.46 166.34 ± 6.36 171.32 ± 5.46 169.52 ± 6.21 168.93 ± 6.21 169.05 ± 6.66 170.88 ± 5.82
Zhuang 163.52 ± 5.25 163.64 ± 5.84 164.48 ± 5.73 165.58 ± 5.19 165.29 ± 5.47 165.97 ± 5.59 167.46 ± 5.87
Chinese Korean 165.84 ± 5.73 167.15 ± 7.38 169.03 ± 5.42 170.98 ± 5.52 170.81 ± 6.96 171.42 ± 6.17 172.77 ± 9.81
Tibetan 164.59 ± 5.11 168.04 ± 6.00 167.58 ± 5.88 168.70 ± 5.10 169.35 ± 5.60 170.13 ± 5.67 170.08 ± 5.89
Miao 159.44 ± 5.90 161.55 ± 5.58 161.52 ± 4.79 162.21 ± 4.92 163.08 ± 4.79 162.08 ± 5.33 162.66 ± 4.94
Buyi 158.09 ± 5.30 160.89 ± 4.92 160.28 ± 4.71 162.27 ± 5.79 162.05 ± 5.17 161.64 ± 5.62 163.37 ± 5.05
Dong 158.99 ± 6.39 162.44 ± 5.27 162.26 ± 5.96 162.57 ± 5.58 164.11 ± 5.63 165.50 ± 6.18 165.64 ± 5.45
Bai 165.06 ± 5.67 - 168.13 ± 6.21 168.59 ± 5.99 168.49 ± 5.69 171.08 ± 5.88 171.72 ± 5.52
Tujia 162.04 ± 4.54 - 161.41 ± 4.91 164.98 ± 5.59 163.57 ± 5.60 166.94 ± 5.29 168.66 ± 5.38
Hani 160.25 ± 5.49 163.60 ± 4.98 - 163.92 ± 5.06 164.75 ± 5.31 164.18 ± 4.99 164.51 ± 5.61
Dai 161.92 ± 4.78 - 163.68 ± 5.23 164.83 ± 5.63 165.62 ± 5.01 166.85 ± 5.66 166.52 ± 5.38
Lisu 162.10 ± 4.53 163.22 ± 4.83 - 161.39 ± 5.83 163.33 ± 5.89 165.35 ± 6.44 166.48 ± 6.41
Wa 159.43 ± 5.12 160.51 ± 5.30 - 163.33 ± 7.23 163.22 ± 5.95 162.78 ± 6.56 163.05 ± 5.31
Naxi 166.48 ± 4.59 168.02 ± 6.00 - 168.82 ± 5.21 169.80 ± 5.74 169.74 ± 5.77 171.65 ± 5.64
Tu 165.32 ± 5.64 164.91 ± 5.51 165.29 ± 5.78 168.27 ± 6.28 163.57 ± 5.60 169.19 ± 5.23 171.16 ± 5.57
Qiang 163.17 ± 5.87 165.80 ± 5.77 165.60 ± 4.85 168.47 ± 5.74 167.45 ± 5.51 168.05 ± 5.77 169.59 ± 5.93
Difference everyten years(cm)
Ⅰ(cm)
Ethnic
1985⁃2000 2000⁃2010 2010⁃2019 1985⁃2019
Mongolian -1.47 ** -1.84 ** -2.24 ** 6.07 ** 1.79
** ** ** **
Hui -1.11 -4.93 -0.37 6.27 1.84
Uyghur -3.98 ** -2.39 ** -2.17 ** 5.53 ** 1.63
Zhuang -0.64 ** -0.81 ** -2.41 ** 3.94 ** 1.16
Chinese Korean -2.13 ** -1.78 ** -2.18 ** 6.93 ** 2.04
Tibetan -1.99 ** -1.77 ** -0.81 ** 5.49 ** 1.61
Miao -1.39 ** -1.56 ** -0.47 ** 3.22 ** 0.95
** ** ** **
Buyi -1.46 -1.77 -1.47 5.28 1.55
Dong -2.18 ** -1.85 ** -1.70 ** 6.65 ** 1.96
Bai -2.05 ** -0.36 ** -3.59 ** 6.66 ** 1.96
Tujia -0.42 ** -2.16 ** -5.66 ** 6.62 ** 1.95
Hani - - -0.27 ** 4.26 ** 1.25
Dai -1.17 ** -1.94 ** -1.00 ** 4.60 ** 1.35
** **
Lisu - - -3.50 4.38 1.29
Wa - - -0.19 ** 3.62 ** 1.06
Naxi - - -2.06 ** 5.17 ** 1.52
Tu -0.02 ** -1.72 ** -8.43 ** 5.84 ** 1.72
Qiang -1.62 ** -1.85 ** -2.38 ** 6.42 ** 1.89
The ethnic groups of Mongolian,Bai,Tujia,and Dai were not surveyed in 1995,while the ethnic groups of Hani,Lisu,Wa,and Naxi were not sur⁃
*
**
veyed in 2000.“Ⅰ”represents the average difference every ten years from 1985 to 2019. Compared with the previous survey year,P < 0.05,P < 0.01.
族(2.12 cm)、哈尼族(2.02 cm)、傣族(1.99 cm)、藏
3 讨 论
族(1.84 cm)。此外,布依族女生与维吾尔族女生身
高变化差异无统计学意义(P > 0.05,表3)。 研究结果显示,我国少数民族男生均出现了较