
Page 83 - 南京医科大学自然版
P. 83
第44卷第4期 马云飞,李成跃,阿力木江·依米提·塔尔肯. 1985—2019年中国18个少数民族17岁学生
2024年4月 身高长期趋势分析[J]. 南京医科大学学报(自然科学版),2024,44(04):517-523 ·521 ·
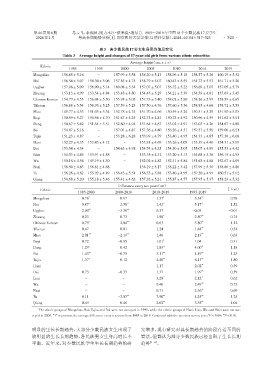
表3 各少数民族17岁女生身高均值及变化
Table 3 Average height and changes of 17⁃year⁃old girls from various ethnic minorities
Average height(cm,x ± s)
Ethnic
1985 1995 2000 2005 2010 2014 2019
Mongolian 156.85 ± 5.16 - 157.99 ± 5.58 158.20 ± 5.13 158.96 ± 5.18 158.57 ± 5.26 160.19 ± 5.32
Hui 156.54 ± 5.07 158.30 ± 5.06 157.85 ± 4.75 158.79 ± 5.07 160.43 ± 5.59 161.73 ± 5.53 161.71 ± 5.20
Uyghur 157.08 ± 5.09 156.90 ± 5.14 160.08 ± 5.34 157.07 ± 5.07 156.72 ± 5.22 156.69 ± 5.07 157.05 ± 5.79
Zhuang 153.13 ± 4.99 153.54 ± 4.84 153.48 ± 4.80 154.45 ± 5.29 154.21 ± 5.39 154.38 ± 4.81 155.63 ± 5.45
Chinese Korean 154.79 ± 4.53 156.04 ± 5.50 155.98 ± 5.05 157.73 ± 5.40 158.02 ± 5.80 158.26 ± 5.99 158.59 ± 6.65
Tibetan 156.88 ± 5.54 156.93 ± 5.25 157.59 ± 5.23 157.50 ± 4.76 157.60 ± 5.36 158.85 ± 4.66 158.72 ± 5.53
Miao 149.77 ± 4.53 151.05 ± 5.34 152.78 ± 4.74 151.70 ± 4.66 150.59 ± 5.24 150.51 ± 5.29 151.90 ± 5.05
Buyi 150.59 ± 5.27 150.56 ± 4.70 151.67 ± 4.25 152.73 ± 4.81 150.72 ± 4.92 150.96 ± 4.59 151.63 ± 5.01
Dong 150.67 ± 5.62 151.54 ± 5.51 152.60 ± 4.94 151.64 ± 4.67 153.02 ± 4.91 153.03 ± 4.26 154.67 ± 4.88
Bai 154.87 ± 5.16 - 157.01 ± 4.87 157.36 ± 4.80 156.26 ± 4.51 159.51 ± 5.50 159.06 ± 6.21
Tujia 151.23 ± 4.87 - 153.28 ± 6.28 153.99 ± 4.79 153.40 ± 4.95 154.33 ± 4.85 157.36 ± 6.08
Hani 152.29 ± 4.35 153.43 ± 4.12 - 153.81 ± 4.69 153.26 ± 4.05 153.39 ± 4.40 154.31 ± 5.09
Dai 153.54 ± 4.34 - 154.63 ± 4.98 154.74 ± 4.25 154.30 ± 5.05 155.07 ± 4.89 155.53 ± 4.42
Lisu 154.03 ± 4.45 153.91 ± 4.88 - 153.18 ± 4.32 153.20 ± 5.13 154.68 ± 5.36 156.15 ± 4.95
Wa 150.18 ± 4.56 149.19 ± 4.30 - 152.02 ± 4.82 152.31 ± 5.84 151.63 ± 4.88 152.67 ± 4.69
Naxi 156.50 ± 4.83 156.81 ± 4.68 - 158.19 ± 5.17 158.22 ± 5.42 157.99 ± 5.50 158.86 ± 4.86
Tu 156.26 ± 4.62 155.92 ± 4.89 156.43 ± 5.51 156.53 ± 5.88 153.40 ± 4.95 159.20 ± 4.99 160.51 ± 5.02
Qiang 154.68 ± 5.20 155.18 ± 5.46 155.41 ± 4.62 157.32 ± 5.21 155.87 ± 4.77 157.95 ± 5.37 158.23 ± 5.32
Difference every ten years(cm)
Ethnic Ⅰ(cm)
1985⁃2000 2000⁃2010 2010⁃2019 1985⁃2019
** ** ** **
Mongolian 0.76 -0.97 1.37 -3.34 -0.98
Hui 0.87 ** -2.58 ** 1.42 ** -5.17 ** -1.52
Uyghur 2.00 ** -3.36 ** 0.37 ** -0.03 ** -0.01
Zhuang 0.23 ** -0.73 ** 1.58 ** -2.50 ** -0.74
Chinese Korean 0.79 ** -2.04 ** 0.63 ** -3.80 ** -1.12
Tibetan 0.47 ** -0.01 ** 1.24 ** -1.84 ** -0.54
** ** ** **
Miao 2.01 -2.19 1.46 -2.13 -0.63
Buyi 0.72 ** -0.95 ** 1.01 ** -1.04 ** -0.31
Dong 1.29 ** -0.42 ** 1.83 ** -4.00 ** -1.18
Bai 1.43 ** -0.75 ** 3.11 ** -4.19 ** -1.23
Tujia 1.37 ** -0.12 ** 4.40 ** -6.13 ** -1.80
Hani - - 1.17 ** -2.02 ** -0.59
** ** ** **
Dai 0.73 -0.33 1.37 -1.99 -0.59
Lisu - - 3.28 ** -2.12 ** -0.62
Wa - - 0.40 ** -2.49 ** -0.73
Naxi - - 0.71 ** -2.36 ** -0.69
Tu 0.11 ** -3.03 ** 7.90 ** -4.25 ** -1.25
Qiang 0.49 ** -0.46 ** 2.62 ** -3.55 ** -1.04
The ethnic groups of Mongolian,Bai,Tujia,and Dai were not surveyed in 1995,while the ethnic groups of Hani,Lisu,Wa,and Naxi were not sur⁃
*
**
veyed in 2000.“I”represents the average difference every ten years from 1985 to 2019. Compared with the previous survey year,P < 0.05;P < 0.01.
明显的生长长期趋势,大部分少数民族女生出现了 究增多,现有研究对其长期趋势的阶段有着不同的
较明显的生长长期趋势,各民族男女生身高增长不 看法,但都认为部分少数民族已经出现了生长长期
平衡。近年来,对少数民族学生生长长期趋势的研 趋势 [9-12] 。