Page 89 - 南京医科大学自然版
P. 89

第44卷第5期 叶 倩,杨        云,徐文韬,等. 基于可解释机器学习构建脑卒中患者日常生活自理能力风险预测模型[J].
                  2024年5月                     南京医科大学学报(自然科学版),2024,44(5):672-680                        ·677 ·


                    A      40   40  35  30  17   3   2           B      41 41 41 41 41 41 40 40 37 33 31 25 16 8 2 2 2
                                                                     2.0
                          0                                          1.8
                       Coefficliens  -10                            Binomial Deviance  1.4
                                                                     1.6
                         -5
                                                                     1.2
                        -15                                          1.0
                                                                     0.8
                        -20                                          0.6
                             -8 -7  -6  -5  -4  -3  -2                    -10     -8     -6      -4      -2
                                     Log(Lambda)                                     Log(Lambda)
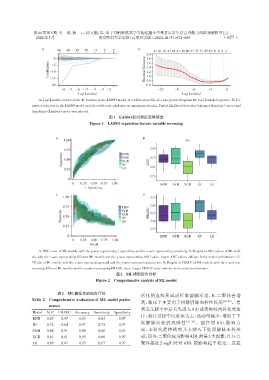
                   A:Log(Lambda)values of the 41 features in the LASSO model. A coefficient profile plot was produced against the log(Lambda)sequence. B:Pa⁃
                rameter selection in the LASSO model used five⁃fold cross validation via minimum criterion. Partial likelihood deviation(binomial deviation)curves and
                logarithmic(Lambda)curves were plotted.
                                                   图1 LASSO回归特征变量筛选
                                          Figure 1 LASSO regression feature variable screening


                           A                                       B
                               1.00                                                   dva
                                                                       0.8
                               0.75                      KNN
                              Sensitivity  0.50          SVM          AUC  0.7
                                                         XGB
                                                         RF
                                                         LR            0.6
                               0.25
                                                                       0.5
                                 0
                                 0.0  0.25  0.50  0.75  1.00               KNN   SVM  XGB   RF    LR
                                        1-Specificity
                           C                                       D
                              1.00                                     0.7
                                                                       0.6
                              0.75                       KNN
                             Precision  0.50             XGB          PRAUC  0.5
                                                         SVM
                                                         RF
                                                                       0.4
                              0.25                       LR
                                                                       0.3
                                0                                          KNN   SVM  XGB   RF    LR
                                 0.0  0.25  0.50  0.75  1.00
                                          Recall
                   A:ROC curve of ML models,with the y⁃axis representing 1⁃specificity and the x⁃axis representing sensitivity. B:Boxplot of AUC values of ML mod⁃
                els,with the x⁃axis representing different ML models and the y⁃axis representing AUC value. Larger AUC values indicate better model performance. C:
                PR plot of ML models with the x⁃axis representing recall and the y⁃axis representing precision. D:Boxplot of PRAUC of ML models,with the x⁃axis rep⁃
                resenting different ML models and the y⁃axis representing PRAUC value. Larger PRAUC value indicate better model performance.
                                                       图2  ML模型综合分析
                                             Figure 2  Comprehensive analysis of ML model


                            表2 ML模型性能综合评估                         活化的血栓形成或纤维溶解活动,D⁃二聚体会增
                Table 2  Comprehensive evaluation of ML model perfor⁃  高,临床上主要用于排除静脉血栓性疾病               [20-21] 。患
                        mance
                                                                  者发生脑卒中后首先进入ICU或者神经内科接受治
                Model  AUC  PRAUC   Accuracy  Sensitivity  Specificity
                                                                  疗,治疗过程中以卧床为主,活动量减少,增加了下
                KNN    0.67  0.47    0.93     0.63      0.97
                                                                  肢静脉血栓的风险性            [22- 24] 。但在对 ADL 影响方
                RF     0.74  0.64    0.97     0.75      0.97
                                                                  面,本研究最终模型并未纳入下肢深静脉血栓形
                SVM    0.68  0.51    0.90     0.60      0.97
                XGB    0.61  0.41    0.93     0.60      0.97      成,而 D⁃二聚体成为影响ADL的第3大因素,且D⁃二
                LR     0.69  0.47    0.95     0.67      0.97      聚体接近2 mg/L 时对 ADL 的影响趋于稳定。这提
   84   85   86   87   88   89   90   91   92   93   94