Page 90 - 南京医科大学自然版
P. 90

第44卷第5期
               ·678 ·                            南 京    医 科 大 学 学         报                        2024年5月


              A                                               B
                Brunnstrom(lower limb)                          Brunnstrom(lower limb)                     High
               Brunnstrom(upper limb)                           Brunnstrom(upper limb)
                          D⁃dimer                                         D⁃dimer
                            ALB                                              ALB
                             Age                                             Age
                         RDW⁃CV                                          RDW⁃CV
                           HDL⁃C                                           HDL⁃C
                             PCT                                             PCT
                             INR                                             INR                              Feature value
                            HGB                                             HGB
                            RBC                                              RBC
                    Use⁃of⁃antiplatelet                             Use⁃of⁃antiplatelet
                          Alcohol                                          Alcohol
                        Past⁃stroke                                      Past⁃stroke
                        Srtoke⁃type                                     Srtoke⁃type
                           Smoke                                           Smoke
                                                                                                           Low
                              0.0  0.01 0.02 0.03 0.04 0.05 0.06                 -0.05  0 0.05 0.10 0.15 0.20 0.25
                     mean(|SHAP value|)(average impact on model output magnitude)  SHAP value(impact on model output)
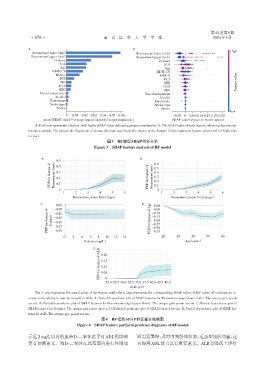
                 A:Each row represents a feature,with higher SHAP value indicating greater contribution. B:The SHAP value of each feature,where each point rep⁃
              resents a sample. The greater the dispersion of points,the more significant the impact of the feature. Colors represent feature values(red for high,blue
              for low).
                                                   图3  RF模型SHAP特征分析
                                            Figure 3 SHAP feature analysis of RF model


                    A     (limb)  0.5                             B     0.6
                        PDP for feature of  Brunnstrom  0.3          PDP for feature of  (arm) Brunnstrom  0.5
                           0.4
                                                                        0.4
                                                                        0.3
                           0.2
                                                                        0.2
                           0.1
                            0                                           0.1 0
                              1     2    3     4     5    6                1     2     3    4     5    6
                                   Brunnstrom_lower limb(stage)                 Brunnstrom_upper limb(stage)
                    C     -0.05                                   D   Age  -0.05
                           0.00
                                                                        0.00
                       PDP for feature of  D⁃dimer  -0.10             PDP for feature of  -0.10
                                                                       -0.15
                          -0.15
                                                                       -0.20
                          -0.20
                                                                       -0.25
                          -0.25
                                                                       -0.30
                          -0.30
                              0   2   4   6   8   10  12  14           -0.35  20   30    40     50     60
                                        D⁃dimer(mg/L)                                 Age(years)
                                            E
                                               ALB
                                               PDP for feature of 0.20
                                                0.15
                                                0.10
                                                0.05
                                                  0
                                                  25.0 27.5 30.0 32.5 35.0 37.5 40.0 42.5 45.0
                                                             ALB(g/L)
                 The x⁃axis represents the actual value of the feature,while the y⁃axis represents the corresponding SHAP value;SHAP value >0 indicates an in⁃
              crease in the ability to care for oneself in ADL. A:Partial dependence plot of SHAP features for Brunnstrom stage(lower limb). The unique grio points
              are six. B:Partial dependence plot of SHAP features for Brunnstrom stage(upper limb). The unique grio points are six. C:Partial dependence plot of
              SHAP features for D⁃dimer. The unique grio points are ten. D:Partial dependence plot of SHAP features for age. E:Partial dependence plot of SHAP fea⁃
              tures for ALB. The unique grio points are ten.
                                                图4 RF模型SHAP特征部分依赖图
                                    Figure 4 SHAP feature partial dependence diagrams of RF model

              示近2 mg/L以内的血清D⁃二聚体水平对ADL的影响                       即需要警惕,及时改变卧床状态,适当增加活动量,这
              更有预测意义。当D⁃二聚体在此范围内进行性增加                           对提高ADL能力具有重要意义。ALB是临床上评价
   85   86   87   88   89   90   91   92   93   94   95