
Page 85 - 南京医科大学自然版
P. 85
第44卷第6期 孔秋月,刘 洋,李 楠,等. 经皮二氧化碳测量在腹膜后腹腔镜泌尿外科手术中的准确性:
2024年6月 一项前瞻性观察性研究[J]. 南京医科大学学报(自然科学版),2024,44(6):818-825 ·821 ·
2
eligibility,of whom 31 were excluded due to severe BMI of(23.34 ± 2.99)kg/m . Thirty ⁃ one underwent
complications,a history of surgery,or morbid obesity. partial nephrectomy,while the rest underwent nephrec⁃
Within the remaining 66 subjects,6 were reluctant to tomy,urethroplasty,and renal cyst excision. The mean
participate and 10 were excluded because phenylephrine duration of CO2 pneumoperitoneum was 91.42(30.00-
was used during anesthesia induction and surgery. Fi⁃ 192.00)min.
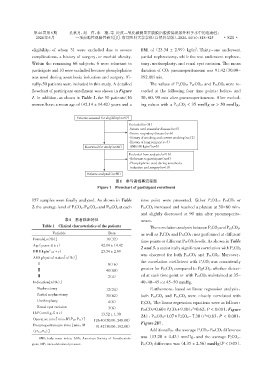
nally,50 patients were included in this study. A detailed The values of PaCO2,PETCO2,and PTCCO2 were re⁃
flowchart of participant enrollment was shown in Figure corded at the following four time points:before,and
1. In addition,as shown in Table 1,the 50 patients(16 30,60,90 min after pneumoperitoneum. After exclud⁃
women)have a mean age of(42.14 ± 14.42)years and a ing values with a P ETCO2 < 35 mmHg or > 50 mmHg,
Patients assessed for eligibility(n=97)
Excluded(n=31)
⁃Severe card ovascular disease(n=5)
⁃Severe respratory disease(n=6)
⁃History of smoking and current smoking(n=12)
⁃History of lung surgery(n=3)
Recruited for study(n=66) ⁃BMI≥30 kg/m(n=5)
2
Excluded from analysis(n=16)
⁃Reluctant to participate(n=6)
⁃Phenylephrine used during anesthesia
induction and surgery(n=10)
Patients analyzed(n=50)
图1 参与者招募流程图
Figure 1 Flowchart of participant enrollment
157 samples were finally analyzed. As shown in Table time point were presented. Either P aCO2,PETCO2 or
2,the average level of P aCO2,PETCO2,and PTCCO2at each PTCCO2 increased and reached a plateau at 30-60 min,
and slightly decreased at 90 min after pneumoperito⁃
表1 患者临床特征 neum.
Table 1 Clinical characteristics of the patients The correlation analysis between P aCO2 and PETCO2,
Variable Data as well as PaCO2 and PTCCO2,was performed at different
Female[n(%)] 16(32)
time points or different P ETCO2levels. As shown in Table
Age(years,x ± s) 42.14 ± 14.42
2 and 3,a statistically significant correlation with P aCO2
BMI(kg/m ,x ± s) 23.34 ± 2.990
2
was observed for both P ETCO2 and PTCCO2. Moreover,
ASA physical status[n(%)]
the correlation coefficient with P aCO2 was consistently
Ⅰ 08(16)
Ⅱ 40(80) greater for PTCCO2 compared to PETCO2,whether detect⁃
Ⅲ 2(4) ed at each time point or with P ETCO2 maintained at 35-
Indication[n(%)] 40,40-45,or 45-50 mmHg.
Nephrectomy 12(24) Furthermore,based on linear regression analysis,
Partial nephrectomy 31(62) both PETCO2 and PTCCO2 were closely correlated with
Urethroplasty 4(8) PaCO2. The linear regression equations were as follows:
Renal cyst excision 3(6) PETCO2=0.60×PaCO2+9.10(r =0.62,P < 0.001,Figure
2
IAP(mmHg,x ± s)
13.52 ± 1.300 2A),PTCCO2=1.07 × PaCO2- 7.30(r =0.83,P < 0.001,
2
Operative time[min,M(P25,P75)] 126.40(50.00,248.00)
Pneumoperitoneum time[min,M 091.42(30.00,192.00) Figure 2B).
(P25,P75)] Additionally,the average PaCO2⁃PETCO2 difference
was(13.20 ± 4.43)mmHg,and the average P aCO2 ⁃
BMI:body mass index;ASA:American Society of Anesthesiolo⁃
gists;IAP:intra⁃abdominal pressure. PTCCO2 difference was(4.35 ± 2.56)mmHg(P < 0.05).