Page 86 - 南京医科大学自然版
P. 86

第44卷第6期
               ·822 ·                            南 京    医 科 大 学 学         报                        2024年6月

              表 2  不同时间点的 PETCO2与 PaCO2、PTCCO2与 PaCO2相关         Among all 157 samples,a difference ≤5 mmHg or
                   性分析                                          ≤3 mmHg between PaCO2 and PETCO2 was observed in
              Table 2  The correlation analysis between P ETCO2 and  5(3.2%)and 1(0.6%)sample,respectively. However,
                      PaCO2 or letween PTCCO2 and PaCO2 at differ⁃
                      ent time points          (mmHg,x ± s)     表 3  不同 PETCO2水平下 PETCO2与 PaCO2、PTCCO2与 PaCO2

                      Time point         Value     r    P            的相关性分析
                                                                Table 3  The correlation analysis between P ETCO2 and
               Before pneumoperitoneum
                                                                         PaCO2 or between PTCCO2 and PaCO2 at different
                                       48.03 ± 3.53  -  -
                PaCO2
                                                                         PETCO2 levels           (mmHg,x ± s)
                                       36.92 ± 2.29  0.45  0.005
                PETCO2
                                       44.34 ± 4.26  0.81 < 0.001    Group         Values        r        P
                PTCCO2
               30 min after pneumoperitoneum                      35≤PETCO2<40
                                       57.48 ± 6.15  -  -                        50.61 ± 4.96    -        -
                PaCO2                                              PaCO2
                                       43.65 ± 4.33  0.70 < 0.001                37.73 ± 1.91   0.64    < 0.001
                PETCO2                                             PETCO2
                                       53.29 ± 7.80  0.90 < 0.001                46.51 ± 5.94   0.88    < 0.001
                PTCCO2                                             PTCCO2
               60 min after pneumoperitoneum                      40≤PETCO2<45
                                       58.81 ± 5.91  -  -                        56.89 ± 4.49    -        -
                PaCO2                                              PaCO2
                                       43.62 ± 3.94  0.64 < 0.001                43.12 ± 1.39   0.50    < 0.001
                PETCO2                                             PETCO2
                                       54.82 ± 7.04  0.85 < 0.001                54.82 ± 7.04   0.75    < 0.001
                PTCCO2                                             PTCCO2
               90 min after pneumoperitoneum                      45≤PETCO2<50
                                       56.15 ± 6.72  -  -                        63.11 ± 6.20    -        -
                PaCO2                                              PaCO2
                                       44.79 ± 5.88  0.78 < 0.001                50.03 ± 2.08   0.42     0.010
                PETCO2                                             PETCO2
                                       54.00 ± 9.10  0.91 < 0.001                61.76 ± 6.31   0.85    < 0.001
                PTCCO2                                             PTCCO2
                        A                                         B
                            60                                        80
                               PETCO2=0.60×PaCO2+9.10                    PTCCO2=1.07×PaCO2-7.30
                                2
                                                                          2
                               r =0.62                                70  r =0.83
                           (mmHg)  50                                (mmHg)  60
                               P < 0.001
                                                                         P < 0.001
                           PETCO2  40                                PTCCO2  50
                                                                      40

                            30                                        30
                             35     45    55    65    75                35    45    55    65    75
                                       PaCO2 (mmHg)                               PaCO2 (mmHg)
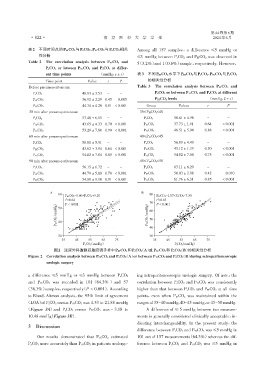
                          图2 泌尿外科腹膜后腹腔镜手术中PETCO2和PaCO2 (A)或 PTCCO2和 PaCO2 (B)的相关性分析
              Figure 2  Correlation analysis between P ETCO2 and PaCO2 (A)or between PTCCO2 and PaCO2 (B)during retroperitoneoscopic
                      urologic surgery


                                                                ing retroperitoneoscopic urologic surgery. Of note,the
              a difference ≤5 mmHg or ≤3 mmHg between PaCO2
              and PTCCO2 was recorded in 101(64.3% )and 57      correlation between P aCO2 and PTCCO2 was consistently
             (36.3%)samples,respectively(P < 0.001). According  higher than that between P aCO2 and PETCO2 at all time
              to Bland⁃Altman analysis,the 95% limit of agreement  points,even when PETCO2 was maintained within the
             (LOA)of PaCO2 versus PETCO2 was 4.53 to 21.88 mmHg  ranges of 35-40 mmHg,40-45 mmHg,or 45-50 mmHg.
             (Figure 3A)and PaCO2 versus PTCCO2 was - 3.18 to        A difference of ≤ 5 mmHg between two measure⁃
              10.48 mmHg(Figure 3B).                            ments is generally considered clinically acceptable,in⁃
                                                                dicating interchangeability. In the present study,the
              3   Discussion
                                                                difference between P aCO2 and PTCCO2 was ≤5 mmHg in
                  Our results demonstrated that P TCCO2 estimated  101 out of 157 measurements(64.3%)whereas the dif⁃
              PaCO2 more accurately than P ETCO2 in patients undergo⁃  ference between P aCO2 and PETCO2 was ≤5 mmHg in
   81   82   83   84   85   86   87   88   89   90   91