


Page 52 - 南京医科大学自然版
P. 52
第44卷第12期
               ·1666 ·                           南 京    医 科 大 学 学         报                        2024年12月


              A  100           CGGA          B  100          Rembrandt        C  100          Gravendeel
                (%)  75      Log⁃rank P=0.001   (%)  75     Log⁃rank P=0.003     (%)  75     Log⁃rank P < 0.001
                                                                                              IBSP high(n=187)
                                                              IBSP high(n=187)
                              IBSP high(n=187)
                                                                                              IBSP low(n=187)
                              IBSP low(n=187)
                                                              IBSP low(n=187)
                Overall survival  50            Overall survival  50             Overall survival  50
                                                 25
                                                                                  25
                 25
                  0                               0                                0
                    0        50      100            0    25   50   75   100          0      50      100     150
                            Time(months)                    Time(months)                    Time(months)
              D
                  Uni_cox          P    Hazard ratio((95%CI))
                  IBSP           < 0.001  1.385(1.320-1.452)  H
                  Age            < 0.001  1.067(1.057-1.077)  I
                  Sex             0.156  1.204(0.932-1.556)
                  Race            0.755  0.942(0.645-1.374)
                  Grade          < 0.001  3.369(2.278-4.984)
                  Radiation therapy  0.009  2.071(1.200-3.572)
                                                          1  2  3  4 5
                                                            Hazard ratio
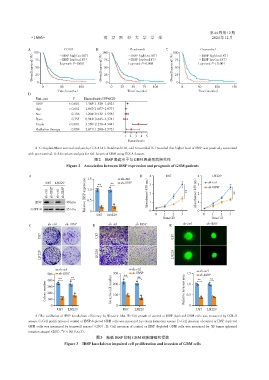
                 A-C:Kaplan⁃Meier survival analysis by CGGA(A),Rembrandt(B),and Gravendeel(C)revealed that higher level of IBSP was positively associated
              with poor survival. D:Univariate analysis for risk factors of GBM using TCGA dataset.
                                             图2  IBSP表达水平与GBM患者预后相关性
                                Figure 2 Association between IBSP expression and prognosis of GBM patients

              A                          1.5             sh⁃ctrl  B           U87           4      LN229
                      U87  LN229              **    **   sh⁃IBSP     (450 nm) 4 3           2 (450 nm)  3  sh⁃ctrl
                                                                                                 sh⁃IBSP
                       sh⁃ctrl  sh⁃IBSP  sh⁃ctrl  sh⁃IBSP  Relative IBSP expression  1.0  2  **               **

                 IBSP           40 kDa   0.5                         Absorbance  1          Absorbance  1
               GAPDH            35 kDa     0                          0                     0
                                              U87  LN229                 0   1   2   3         0   1   2   3
                                                                            Time(d)                Time(d)
                       sh⁃ctrl  sh⁃IBSP            sh⁃ctrl      sh⁃IBSP               sh⁃ctrl   sh⁃IBSP
              C                             D                                  E
                    U87                       U87                                U87


                    LN229                     LN229                              LN229


                            sh⁃ctrl                           sh⁃ctrl
                                                                                             sh⁃ctrl
                       500  sh⁃IBSP                  300  **  sh⁃IBSP                  1.5   sh⁃IBSP
                                  **                            **
                            **                                                                    **
                       400                           200                               1.0  **
                      Colony number  300            Invasive ccll number  100         Relative invasion area  0.5
                       200
                       100
                        0                              0                                0
                           U87   LN229                    U87  LN229                        U87  LN229
                 A:The validation of IBSP knockdown efficiency by Western blot. B:Cell growth of control or IBSP depleted GBM cells was measured by CCK⁃8
              assays. C:Cell proliferation of control or IBSP depleted GBM cells was measured by colony formation assays. D:Cell invasion of control or IBSP depleted
              GBM cells was measured by transwell assays(×200). E:Cell invasion of control or IBSP depleted GBM cells was measured by 3D tumor spheroid
                             **
              invasion assays(×200). P < 0.01(n=3).
                                             图3   敲低IBSP抑制GBM细胞增殖和侵袭
                               Figure 3 IBSP knockdown impaired cell proliferation and invasion of GBM cells

