Page 26 - 南京医科大学自然版
P. 26

第45卷第3期
               ·314 ·                            南 京    医 科 大 学 学         报                        2025年3月


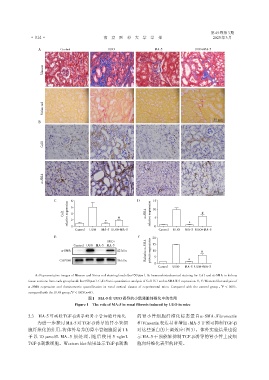
                   A         Control               UUO                  MA⁃5               UUO+MA⁃5


                     Masson


                     Sirius red


                                                                                                    50 μm
                   B


                     Col1


                     α⁃SMA


                                                                                                    50 μm

                          C       8 6                           D       15
                                relative expression  2  *  #        α⁃SMA  relative expression  5
                              Col1  4                                   10                    #

                                                                                        *
                                  0
                                    Control  UUO  MA⁃5 UUO+MA⁃5         0  Control  UUO  MA⁃5 UUO+MA⁃5
                          E                                      F     20
                                                  UUO+
                                   Control UUO MA⁃5 MA⁃5            α⁃SMA  15
                             α⁃SMA                     42 kDa         protein expression  10  #
                                                                    Relative  5
                             GAPDH                     36 kDa                           *
                                                                        0
                                                                          Control  UUO  MA⁃5 UUO+MA⁃5
                 A:Representative images of Masson and Sirius red staining(scale bar=50 μm). B:Immunohistochemical staining for Col1 and α⁃SMA in kidney
              tissue sections from each group(scale bar=50 μm). C,D:Semi⁃quantitative analysis of Col1(C)and α⁃SMA(D)expression. E,F:Western blot analysis of
              α ⁃SMA expression and densitometric quantification in renal cortical tissues of experimental mice. Compared with the control group ,P < 0.05;
                                                                                                       *
                                  #
              compared with the UUO group,P < 0.05(n=6).
                                          图1 MA⁃5在 UUO诱导的小鼠肾脏纤维化中的作用
                                   Figure 1 The role of MA⁃5 in renal fibrosis induced by UUO in mice


              2.3  MA⁃5可减轻TGF⁃β诱导的肾小管细胞纤维化                      的肾小管细胞纤维化标志蛋白α⁃SMA、Fibronectin
                  为进一步探讨 MA⁃5 对 TGF⁃β诱导的肾小管细                    和Vimentin表达显著增加,MA⁃5干预可抑制TGF⁃β

              胞纤维化的作用,将体外培养的肾小管细胞提前1 h                          对这些蛋白的上调效应(图3)。体外实验结果也提
              予以 10 μmol/L MA⁃5 预处理,随后使用 5 ng/mL                示 MA⁃5 干预能够抑制 TGF⁃β诱导的肾小管上皮细
              TGF⁃β刺激细胞。Western blot结果显示TGF⁃β刺激                 胞向纤维化表型的转变。
   21   22   23   24   25   26   27   28   29   30   31