


Page 111 - 南京医科大学自然版
P. 111
第45卷第6期            夏姚冬琴,焦锦程,曹月洲,等. 心脏生物标志物对卒中后死亡风险的预测价值[J].
                  2025年6月                     南京医科大学学报(自然科学版),2025,45(6):844-853                        ·849 ·


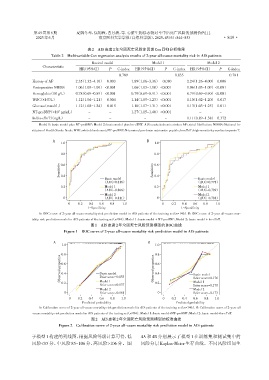
                                         表2 AIS患者2年全因死亡风险多因素Cox回归分析结果
                         Table 2 Multivariable Cox regression analysis results of 2⁃year all⁃cause mortality risk in AIS patients
                                           Basical model               Model 1                   Model 2
                     Characteristic
                                      HR(95%CI)    P   C⁃index  HR(95%CI)    P   C⁃index  HR(95%CI)   P   C⁃index
                                                        0.789                     0.835                    0.781
                History of AF       2.35(1.32-4.16) 0.003     1.89(1.06-3.36) 0.030    2.24(1.26-4.00) 0.006
                Postoperative NIHSS  1.06(1.03-1.09) <0.001   1.06(1.03-1.10) <0.001   1.06(1.03-1.09)<0.001
                Hemoglobin(10 g/L)  0.78(0.69-0.89) <0.001    0.79(0.69-0.91) <0.001   0.79(0.69-0.90)<0.001
                WBC(×10 /L)         1.12(1.04-1.21) 0.004     1.14(1.05-1.23) <0.001   1.10(1.02-1.20) 0.017
                        9
                Glucose(mmol/L)     1.12(1.02-1.24) 0.015     1.18(1.07-1.31) <0.001   1.13(1.03-1.25) 0.011
                NT⁃proBNP(×10 pg/mL)      -        -          1.27(1.15-1.40) <0.001         -        -
                            3
                ln(hs⁃cTnT)(ng/L)         -        -                -        -         1.11(0.89-1.38) 0.372
                   Model 1:basic model plus NT⁃proBNP;Model 2:basic model plus hs⁃cTNT. AIS:acute ischemic stroke;AF:atrial fibrillation;NIHSS:National In⁃
                stitutes of Health Stroke Scale;WBC:white blood count;NT⁃proBNP:N⁃terminal pro⁃brain natriuretic peptide;hs⁃cTnT:high⁃sensitivity cardiac troponin T.

                         A                                           B
                             1.0                                        1.0

                             0.8                                        0.8

                            Sensitivity  0.6                            Sensitivity  0.6

                             0.4
                                                 Basic model            0.4                  Basic model
                                                 (AUC=0.816)                                (AUC=0.778)
                             0.2                 Model 1                0.2                  Model 1
                                                 (AUC=0.866)                                (AUC=0.799)
                                                 Model 2                                     Model 2
                              0                  (AUC=0.811)             0                  (AUC=0.788)
                                 0   0.2  0.4  0.6  0.8  01.0               0   0.2  0.4  0.6  0.8  01.0
                                         1-Specificity                               1-Specificity
                   A:ROC curve of 2⁃year all⁃cause mortality risk prediction model in AIS patients of the training set(n=146). B:ROC curve of 2⁃year all⁃cause mor⁃
                tality risk prediction model in AIS patients of the testing set(n=84). Model 1:basic model + NT⁃proBNP;Model 2:basic model + hs⁃cTnT.
                                           图1 AIS患者2年全因死亡风险预测模型的ROC曲线
                               Figure 1 ROC curve of 2⁃year all⁃cause mortality risk prediction model in AIS patients


                          A                                          B
                             1.0                                         1.0
                             0.8                                         0.8
                             Observed proportion  0.6  Basic model      Observed proportion  0.6  Basic model


                                                                         0.4
                             0.4
                                               Model 1
                                                                                          Model 1
                             0.2               Brier score=0.153         0.2              Brier score=0.176
                                               Brier score=0.137                          Brier score=0.170
                                               Model 2                                    Model 2
                               0               Brier score=0.161          0               Brier score=0.173
                                00   0.2  0.4  0.6  0.8  1.0               00   0.2  0.4  0.6  0.8  1.0
                                       Predicted probability                      Predicted probability
                   A:Calibration curve of 2⁃year all⁃cause mortality risk prediction model in AIS patients of the training set(n=146). B:Calibration curve of 2⁃year all
                ⁃cause mortality risk prediction model in AIS patients of the testing set(n=84). Model 1:basic model+NT⁃proBNP;Model 2:basic model+hs⁃cTnT.
                                           图2 AIS患者2年全因死亡风险预测模型的校准曲线
                            Figure 2 Calibration curve of 2⁃year all⁃cause mortality risk prediction model in AIS patients

                于模型1构建的列线图,根据风险等级计算可得,低                           4A 和 4B 分别展示了模型 1 在训练集和测试集中的
                风险<85 分,中风险 85~106 分,高风险>106 分。图                  风险分层Kaplan⁃Meier生存曲线。不同风险组间生

