Page 21 - 《南京医科大学学报》自然科学版2026年第2期
P. 21

第46卷第2期          杨 玥,葛 愿,李明辉,等. 基于机器学习的心脏术后衰弱预测模型的构建与验证[J].
                  2026年2月                    南京医科大学学报(自然科学版),2026,46(2):173-180,187                     ·177 ·


                A   Important variables in LASSO  E     Important variables in XGBoost  H  Variable importance plot of RF
                  Valves                                Age                               Age
                 treatment
                                                     Albumin                             LVDd
                  CABG
                                                      LVDd                               LVEF
                    Age                               LVEF                          Hypertension
                                                  Hypertension                         Albumin
                   LVDd
                                               Surgical duration                          Sex
                   LVEF                                 Sex                             CABG
                                                        BMI                            Smoking
                 Albumin
                                                     Smoking
                                                                                  Surgical duration
                    BMI
                                                     Drinking                           Valves
                                                                                       treatment
                         0 0.25 0.50 0.75                  0  0.1 0.2 0.3 0.4                0   5  10  15  20
                           Coefficient                      Importance score                   Importance score
                B        ROC curve of LASSO    F         ROC curve of XGBoost      I         ROC curve of RF
                    1.00                                                               1.00  Cut⁃off=0.309
                         Cut⁃off=0.243              1.00 Cut⁃off=0.238
                    0.75                            0.75                               0.75
                  Sensitivity  0.50                Sensitivity  0.50                 Sensitivity  0.50

                    0.25                            0.25                               0.25
                             AUC=0.795                        AUC=0.839                         AUC=0.838
                           95%CI:0.698-0.892               95%CI:0.757-0.921                 95%CI:0.756-0.920
                      0                               0                                  0
                       0  0.25 0.50 0.75 1.00           0  0.25 0.50 0.75 1.00            0  0.25 0.50 0.75 1.00
                            1-Specificity                   1-Specificity                     1-Specificity
                C                            G                                   J     The relationship between
                      LASSO cross⁃validation results      Beeswarm plot
                                                                                        tree number and OOB
                                                     Age 0.407
                    0.28                          Albumin 0.225                     0.6
                  Classification error  0.24  Surgical duration 0.083  Feature value  Error rate  0.4    Error rate
                                                    LVDd 0.191
                    0.26
                                                    LVEF 0.175
                                                                       High
                                               Hypertension 0.141
                                                                                                          Alive
                                                                       Low
                                                     Sex 0.076
                                                                                                          Death
                    0.22
                                                     BMI 0.044
                    0.20                          Smoking 0.034                     0.2                   OOB
                                                  Drinking 0.033
                           -6    -4    -2              -1.0 -0.5 0 0.5 1.0
                     Min.:0.049 6|1se.:0.059 8|            SHAP value
                         Variables at min.:7          (Impact on model output)        0  100 200 300 400 500
                                                                                          Number of trees
                D            LASSO regression path    Variable                   K    LASSO  XGBoost
                                                       Age           Hypertension
                   2
                                                       Albumin       LAD
                                                       Sex           LVDd
                   1                                   CABG          LVPW              0    1    1
                  Coefficient  0                       Cerebral infarction  PSQI         2  4  4   Common variables:
                                                       COPD
                                                                     BMI
                  -1
                                                       Valves treatment
                                                                     Surgical duration
                                                       Drinking      Smoking                0      LVEF VIF:1.221
                                                                                                   Age VIF:1.024
                  -2                                   LVEF          Diabetes
                        1×10 -3    1×10 -2    1×10 -1                                              Albumin VIF:1.010
                                                                                           RF      LVDd VIF:1.233
                                   logλ
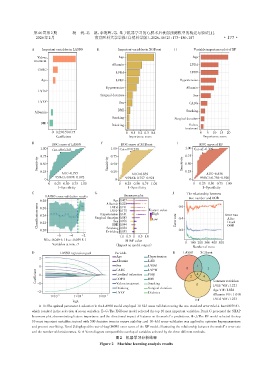
                   A-D:The optimal parameter λ selection in the LASSO model employed 10⁃fold cross⁃validation using the one⁃standard⁃error rule(λ.1se=0.059 8),
                which resulted in the selection of seven variables. E-G:The XGBoost model selected the top 10 most important variables. Panel G presented the SHAP
                beeswarm plot,demonstrating feature importance and the directional impact of features on the model’s predictions. H-J:The RF model selected the top
                10 most important variables,trained with 500 decision trees to ensure stability,and 10⁃fold cross⁃validation was applied to optimize hyperparameters
                and prevent overfitting. Panel J displayed the out⁃of⁃bag(OOB)error curve of the RF model,illustrating the relationship between the model’s error rate
                and the number of decision trees. K:A Venn diagram compared the overlap of variables selected by the three different methods.
                                                      图2   机器学习分析结果
                                               Figure 2  Machine learning analysis results
   16   17   18   19   20   21   22   23   24   25   26