Page 22 - 《南京医科大学学报》自然科学版2026年第2期
P. 22

第46卷第2期
               ·178 ·                            南 京    医 科 大 学 学         报                        2026年2月


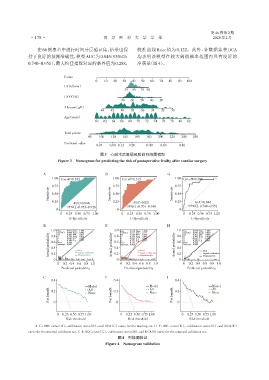
                  在66例患者中进行时间分层验证集,结果也保                         校准曲线 Brier 值为 0.122。此外,各数据集中 DCA
              持了良好的预测准确性,模型AUC为0.846(95%CI:                     均表明该模型在较大阈值概率范围内具有良好的
              0.740~0.951),最大约登指数对应的临界值为0.288,                  净获益(图4)。


                               Points
                                             0   10  20   30  40  50  60   70  80  90  100
                               LVDd(mm)
                                                           35  55  75 90
                               LVEF(%)
                                                         70  60   50  40   30
                               Albumin(g/L)
                                                44  42   40  38   36   34  32   30
                               Age(years)
                                             60  62  64  66  68  70  72  74  76  78  80  82

                               Total points
                                          80   100  120   140  160   180  200  220   240  260
                               Predicted value
                                              0.04  0.08 0.12  0.20  0.40  0.60     0.80
                                               图3 心脏术后衰弱风险的列线图模型
                            Figure 3 Nomogram for predicting the risk of postoperative frailty after cardiac surgery


                     A                            D                           G
                         1.00  Cut⁃off=0.247         1.00  Cut⁃off=0.315          1.00  Cut⁃off=0.288
                         0.75                        0.75                         0.75
                        Sensitivity  0.50           Sensitivity  0.50            Sensitivity  0.50


                         0.25                        0.25                         0.25     AUC=0.846
                                   AUC=0.846                  AUC=0.821
                                95%CI:0.763-0.928           95%CI:0.701-0.940           95%CI:0.740-0.951
                           0                           0                            0
                             0  0.25 0.50 0.75 1.00      0  0.25 0.50 0.75 1.00       0  0.25 0.50 0.75 1.00
                                 1-Specificity               1-Specificity               1-Specificity
                     B                            E                           H
                         1.0 Dxy  0.691 Slope 1.000   1.0 Dxy  0.642 Slope 1.000   1.0 Dxy  0.692 Slope 1.000
                           C(ROC) 0.848 Emax 0.045
                                                                                      C(ROC) 0.846 Emax 0.060
                                                         C(ROC) 0.821 Emax 0.121
                        Actual probability  0.6 Brier  -0.020 S:z  -0.257  Actual probability  0.6 Brier  -0.023 S:z  ldeal 0.775  Actual probability  0.6 Brier  -0.023 S:z  ldeal 0.842
                           R2
                                      0.037
                                0.400 E90
                                                             0.324 E90
                                                                   0.094
                                                                                                0.040
                                                         R2
                                                                                          0.401 E90
                                                                                      R2
                                                                   0.045
                                      0.016
                                                                                   0.8 D
                                                             0.232 Eavg
                                0.328 Eavg
                         0.8 D
                                                      0.8 D
                                                                                          0.300 Eavg
                                                                                                0.020
                           U
                                                         U
                                                                                               -0.199
                                                                                      U
                                                                  -0.286
                                                             0.255 S:p
                                                         Q
                                                                                          0.322 S:p
                                0.348 S:p
                                                                                      Q
                           Q
                                      0.797
                                                                                          0.122
                                0.144
                                                             0.131
                                                                                      Intercept 0.000
                                                         Intercept 0.000
                           Intercept 0.000
                                                      0.4
                                                                                   0.4
                         0.4
                                     ldeal
                         0.2
                                     Nonparametric
                                                                  Nonparametric
                                                                                               Nonparametric
                          0          Logistic calibration  0.2 0  Logistic calibration  0.2 0  Logistic calibration
                           0  0.2 0.4 0.6 0.8 1.0        0  0.2 0.4 0.6 0.8 1.0       0  0.2 0.4 0.6 0.8 1.0
                             Predicted probability        Predicted probability        Predicted probability
                     C                            F                           I
                         0.4                          0.4                         0.4
                                          Model                       Model                        Model
                        Net benefit  0.2 0  None    Net benefit  0.2 0  None     Net benefit  0.2 0  None
                                                                      All
                                                                                                   All
                                          All
                           0  0.25 0.50 0.75 1.00        0  0.25 0.50 0.75 1.00      0  0.25 0.50 0.75 1.00
                               Risk threshold               Risk threshold              Risk threshold
                 A-C:ROC curve(A),calibration curve(B),and DCA(C)curve for the training set. D-F:ROC curve(D),calibration curve(E),and DCA(F)
              curve for the internal validation set. G-I:ROC curve(G),calibration curve(H),and DCA(I)curve for the temporal validation set.
                                                       图4 列线图验证
                                                  Figure 4  Nomogram validation
   17   18   19   20   21   22   23   24   25   26   27