Page 87 - 南京医科大学学报自然科学版
P. 87

第44卷第2期        刘婷婷,林佳璐,娄鉴娟,等. 多参数MRI影像组学评估浸润性乳腺癌HER⁃2表达状态的临床
                  2024年2月                应用价值[J]. 南京医科大学学报(自然科学版),2024,44(2):218-227                    ·225 ·


                         A                                           B
                             1.0                                         1.0

                             0.8                                         0.8
                            Sensitivity  0.6                            Sensitivity  0.6


                             0.4
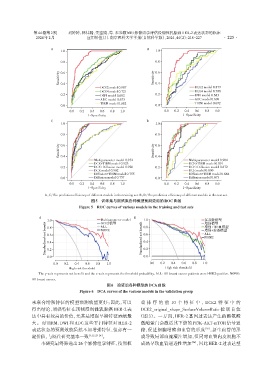
                                               DCE2 model 0.907          0.4               DCE2 model 0.879
                                               DCE4 model 0.721                            DCE4 model 0.708
                             0.2               DWI model 0.682           0.2               DWI model 0.683
                                               ADC model 0.673                             ADC model 0.609
                                               TIRM model 0.662                            TIRM model 0.692
                             0.0                                         0.0
                                 0.0  0.2  0.4  0.6  0.8  1.0                0.0  0.2  0.4  0.6  0.8  1.0
                                          1-Specificity                              1-Specificity
                         C                                           D
                             1.0                                         1.0
                             0.8                                         0.8

                            Sensitivity  0.6                            Sensitivity  0.6


                             0.4
                                             Multiparameter model 0.932  0.4            Multiparameter model 0.904
                                             DCE+TIRM model 0.923                       DCE+TIRM model 0.891
                             0.2             DCE+Diffusion model 0.920   0.2            DCE+Diffusion model 0.872
                                             DCE model 0.902                            DCE model 0.890
                                             Diffusion+TIRM model 0.755                 Diffusion+TIRM model 0.684
                             0.0             Diffusion model 0.757       0.0            Diffusion model 0.673
                                 0.0  0.2  0.4  0.6  0.8  1.0                0.0  0.2  0.4  0.6  0.8  1.0
                                          1-Specificity                              1-Specificity
                      A,C:The prediction efficiency of different models in the training set. B,D:The prediction efficiency of different models in the test set.
                                           图5 训练集与测试集各种模型预测效能的ROC曲线
                                      Figure 5 ROC curves of various models in the training and test sets

                   A                                           B
                       1.0                     Multiparameter model  1.0                       多参数模型
                                               DCE2模型
                                                                                               增强模型
                      Standardized net benefit  0.6  NONE         Standardized net benefit  0.6  增强+弥散模型
                                                                                               增强+TIRM模型
                                               ALL
                                                                   0.8
                       0.8
                                                                                               ALL
                                                                                               NONE
                                                                   0.4
                       0.4
                       0.2
                                                                   0.0
                       0.0                                         0.2
                          0.0  0.2  0.4  0.6  0.8  1.0                0.0  0.2  0.4  0.6  0.8  1.0
                                 High risk threshold                         High risk threshold
                   The y⁃axis represents net benefit and the x⁃axis represents the threshold probability. ALL:All breast cancer patients were HER2⁃positive. NONE:
                All breast cancer.
                                                  图6 验证组各种模型的DCA曲线
                                      Figure 6  DCA curves of the various models in the validation group

                未联合增强特征的模型预测效能更好;因此,可以                            重 排 序 的 前 10 个 特 征 中 ,DCE2 特 征 中 的
                得出结论,增强特征在预测浸润性乳腺癌HER⁃2表                          DCE2_original_shape_SurfaceVolumeRatio 位居首位
                达中具有较高的价值,尤其是增强早期特征贡献最                           (图 3)。一方面,HER⁃2 基因过表达产生的酪氨酸

                大。而 TIRM、DWI 和 ADC 这些平扫特征对 HER⁃2                  激酶蛋白会激活其下游的 PI3K⁃AKT⁃mTOR 信号通
                表达状态的预测效能虽然不如增强特征,但亦有一                            路,促进细胞增殖和血管的形成               [25] ,新生血管的形
                定价值,与既往研究基本一致             [5,12,23-24] 。          成导致局部血流灌注增加,但同时血管内皮细胞不
                    本研究最终筛选出26个影像组学特征,按照权                         成熟导致血管通透性增加            [26] ,因此HER⁃2过表达型
   82   83   84   85   86   87   88   89   90   91   92