Page 66 - 南京医科大学学报自然科学版
P. 66

第44卷第3期
               ·356 ·                          南   京 医 科       大 学      学 报                        2024年3月


                                          表3 PD患者伴发抑郁的多因素Logistic回归分析
                               Table 3 Multivariate logistic regression analysis of PD patients with depression

                  Variables  Regression coefficient  Standard error  z  Wald χ 2  P    Odds Ratio   95% CI
                 PNI              -0.177           0.052     -3.405   11.597   0.001     0.838    0.756-0.928
                 NLR              -0.301           0.140     -2.147   04.608   0.032     1.351    1.026-1.777
                 LED              -0.001           0.001     -2.007   04.027   0.045     1.001    1.000-1.003
                 UPDRS⁃Ⅲ          -0.043           0.013     -3.291   10.828   0.001     1.044    1.018-1.071

                                               0   10  20   30  40   50  60   70  80   90  100
                               Points

                               PNI
                                              62  60  58  56  54  52  50  48  46  44  42  40  38  36
                               NLR
                                               0  1  2  3  4  5  6  7  8  9  10 11
                               LED
                                               0 200   600  1 000  1 400  1 800
                               UPDRS⁃Ⅲ
                                               5   15  25  35  45  55   65  75
                               Total points
                                               0  20  40  60  80  100 120 140 160 180 200 220 240
                               Risk scores
                                                            0.1 0.20.3 0.5 0.7 0.8 0.9
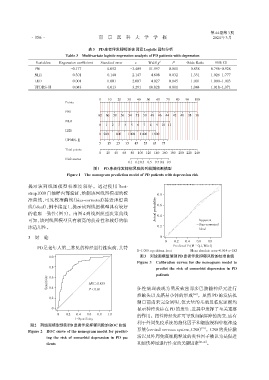
                                            图1 PD患者伴发抑郁风险的列线图预测模型
                                Figure 1 The nomogram prediction model of PD patients with depression risk

              提示该列线图模型校准度较好。通过使用 Boot⁃
              strap1000自抽样内部验证,绘制该列线图模型的校                                 0.8
              准曲线,可见校准曲线(bias⁃corrected)接近理想曲
              线(ideal),斜率接近1,提示该列线图模型具有较好                                Actual probability  0.6
              的临床一致性(图 3)。由图 4 列线图模型决策曲线                                  0.4
              可知,该列线图模型具有较高的获益性和较好的临                                                         Apparent
                                                                                             Bias⁃corrected
              床适用性。                                                       0.2
                                                                                             Ideal
              3  讨 论                                                       0
                                                                            00   0.2   0.4  0.6  0.8
                  PD是老年人第二常见的神经退行性疾病,其特                                          Predicted Pr{M^0jJ,Wi=1}
                                                                B=1 000 repetitions,boot  Mean absolute error=0.014 n=182
                                                                  图3  列线图模型预测PD患者伴发抑郁风险的校准曲线
                        1.0
                                                                Figure 3  Calibration curves for the nomogram model to
                                                                         predict the risk of comorbid depression in PD
                        0.8
                                                                         patients
                       Sensitivity  0.4   AUC:0.835             征性病理表现为黑质致密部多巴胺能神经元进行
                        0.6

                                          P < 0.01
                                                                性缺失以及路易小体的形成              [22] 。虽然PD 的发病机
                        0.2
                                                                制目前尚未完全阐明,但大量的基础及临床证据均
                         0                                      显示神经炎症在PD的发生、进展中发挥了至关重要
                           00   0.2  0.4  0.6  0.8  1.0         的作用。慢性神经炎症可导致血脑屏障的改变,这有
                                    1-Specificity
                                                                利于外周免疫系统的趋化因子和细胞浸润中枢神经
               图2   列线图模型预测PD患者伴发抑郁风险的ROC曲线
                                                                                              [23]
              Figure 2  ROC curve of the nomogram model for predict⁃  系统(central nervous system,CNS) 。CNS的炎症激
                       ing the risk of comorbid depression in PD pa⁃  活以及外周免疫细胞释放的炎性因子被认为是促进
                       tients                                   和加快神经退行性变的关键因素              [24-26] 。
   61   62   63   64   65   66   67   68   69   70   71