Page 70 - 南京医科大学自然版
P. 70

第44卷第6期
               ·806 ·                            南 京    医 科 大 学 学         报                        2024年6月


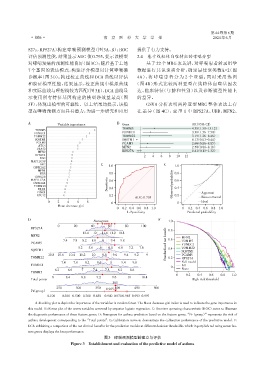
              S27a,RPS27A)构建哮喘预测模型(图 3A、B);ROC                  提供了有力支持。
              评估预测性能,结果显示AUC 值0.795,提示该模型                       2.4  基于线粒体自噬特征的哮喘分型
              对哮喘发病的预测性能良好(图3C);随后基于上述                               基于 22 个 MRG 表达谱,对哮喘患者转录组学
              7 个基因的表达模式,构建评分模型以计算哮喘确                           数据进行共识聚类分析,确定最佳聚类数 k=2(图
              诊概率(图 3D);构建校正曲线和 DCA 曲线以评估                       4A),将哮喘患者分为 2 个亚型;同时采用热图
              和验证模型性能,结果显示,校正曲线中模拟曲线                           (图 4B)形式比较两种亚型在线粒体自噬基因表
              和实际曲线与理想线较为匹配(图3E),DCA曲线显                         达、临床特征(年龄和性别)以及诊断模型性能上
              示使用所有特征基因构建的模型净效益最高(图                             的差异。
              3F),体现出模型的可靠性。以上结果均提示,该模                               GSVA 分析表明两种亚型 MRG 整体表达上存
              型在哮喘预测方面具有潜力,为进一步研究和应用                            在 差 异(图 4C),亚 型 1 中 RPS27A、UBB、MFN2、


              A             Variable importance        B  Gene                            OR(95% CI)
                                                         TOMM5                            4.38(1.50-13.12)
                 TOMM5
                 FUNDC1                                  FUNDC1                           3.36(1.56-7.50)
                 TOMM22                                  TOMM22                           3.19(1.26-8.46)
                 SQSTM1                                  SQSTM1                           0.13(0.03-0.44)
                  PGAM5                                  PGAM5                            2.66(0.86-8.85)
                   ATG5                                  MFN2                             2.50(0.80-8.18)
                  UBA52
                   MFN2                                  RPS27A                           0.41(0.13-1.32)
                 RPS27A                                            2   4   6   8  10  12
                   UBC
               MAP1LC3B
                    SRC                         C  1.0                      E     1.0
                CSNK2A2
                   MFN1
                   UBB                             0.8                            0.8
                 CSNK2B
               MAP1LC3A                            0.6                            0.6
                CSNK2A1                            Sensitivity                   Observed probability
                 TOMM20
                   ULK1                            0.4                            0.4
                  PINK1                                                                       Apparent
                  ATG12                            0.2                            0.2
                                                               AUC:0.795                      Bias⁃corrected
                       0    2   4    6   8                                                    ldeal
                                                    0                              0
                            Mean decrease gini
                                                       0  0.2 0.4 0.6 0.8 1.0        0  0.2 0.4 0.6 0.8 1.0
                                                            1-Specificity              Predicted probability
              D                             Nomogram                      F    1.0
                            0      20      40      60      80     100
               RPS27A                                                          0.8
                                       12.4  12  11.6 11.2 10.8
               MFN2                                                                  MFN2
                              7.4  7.8  8.2  8.6  9  9.4  9.8                  0.6   TOMM5
               PGAM5                                                          Standardized net benefit  FUNDC1
                                     5.2  5.6  6   6.4  6.8  7.2  7.6          0.4   TOMM22
               SQSTM1                                                                SQSTM1
                       10.8 10.6  10.4  10.2  10  9.8  9.6  9.4  9.2  9              PGAM5
               TOMM22                                                          0.2   RPS27A
                             7.4   7.8  8.2   8.6   9    9.4  9.8                    Full model
               FUNDC1                                                                All
                                                                                0
                          6.2   6.6    7    7.4   7.8  8.2   8.6                     None
               TOMM5
                                                                                  00   0.2  0.4   0.6  0.8  1.0
                         8     8.4     8.8    9.2    9.6    10    10.4
               Total points                                                               High risk threshold
                                                     395
                           250      300      350  0.965  400   450      500
               Pr(group)
                       0.100  0.300 0.500 0.700 0.850  0.940 0.970 0.985 0.993 0.997
                 A:Ranking plot to depict the importance of the variables in random forest. The Mean decrease gini index is used to indicate the gene importance in
              this model. B:Forest plot of the seven variables screened by stepwise logistic regression. C: Receiver operating characteristic(ROC)curve to illustrate
              the diagnostic performance of these feature genes. D:Nomogram for asthma prediction based on the feature genes.“Pr(group)”represents the risk of
              asthma development corresponding to the“Total points”. E:Calibration curve to demonstrate the calibration performance of the predictive model. F:
              DCA exhibiting a comparison of the net clinical benefits for the prediction models at different decision thresholds,which in purplish red using seven fea⁃
              ture genes displays the best performance.
                                                 图3 哮喘预测模型的建立与评估
                                  Figure 3 Establishment and evaluation of the predictive model of asthma
   65   66   67   68   69   70   71   72   73   74   75