


Page 60 - 南京医科大学自然版
P. 60
第44卷第12期
·1674 · 南 京 医 科 大 学 学 报 2024年12月
Nephroseq v5 外部数据库(http://v5.nephroseq.org/) 人肾组织基因表达数据(表1),从数据集中提取糖基
中IgAN肾组织和对照组中OFG的表达差异。 化相关基因的表达水平,通过Wilcoxon秩和检验分析
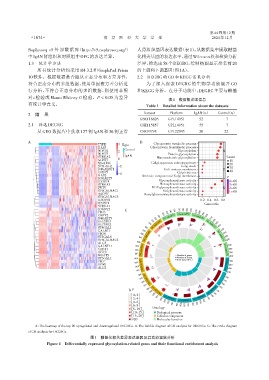
1.3 统计学方法 差异,筛选出58个DEGRG,绘制热图显示排名前20
所有统计分析均采用 R4.3.2 和 GraphPad Prism 的上调和下调基因(图1A)。
10软件。根据数据是否服从正态分布和方差齐性, 2.2 DEGRG的GO和KEGG富集分析
符合正态分布的多组数据,使用单因素方差分析进 为了深入探索 DEGRG 的生物学功能展开 GO
行分析,不符合正态分布的多组数据,则使用非配 和KEGG分析。在分子功能中,DEGRC主要与糖基
对 t 检验或 Mann⁃Whitney U 检验。P < 0.05 为差异
表1 数据集详细信息
有统计学意义。 Table 1 Detailed information about the datasets
2 结 果 Dataset Platform IgAN(n) Control(n)
GSE116626 GPL14951 52 07
2.1 筛选DEGRG GSE115857 GPL14951 55 07
从 GEO 数据库中获取 127 例 IgAN 和 36 例正常 GSE93798 GPL22945 20 22
A B
TYPE 4 Type Glycoprotein metabolic process
HAS3 Glycoprotein biosynthetic process
NDST4 2 Control Glycosylation BP
NDST3 Protein glycosylation
ST8SIA2 IgAN Macromolecule glycosylation Count
GCNT7 0 10
MGAT4C Golgi apparatus subcompatrment 20
ST6GAL2 -2 Golgi stack
B4GALNT1 Goli cistema membrane CC 30
CHST5 -4 Golgi cisterna 40
HAS2 Intrinsic component of Golgi membrane
B3GALT5 P
HS3ST4 Glycosyltransferase activity 4e⁃08
ST8SIA3 Hexosyltransferase activity 3e⁃08
FUT9 UDP⁃glycosyltransferase activity MF 2e⁃08
ST6GALNAC1 Sialyltransferase activity 1e⁃08
A4GNT Acetylglucosaminyltransferase activity
ST6GALNAC5
B3GNT8 0.2 0.4 0.6 0.8
HS3ST1 Gene ratio
ST8SIA1
B3GNT2 C 400 100 200 300 400
PIGB 200 300 100 200
CHPF2 400 100 GO: 0016758 300 400
B4GALT5 300 GO: 0016757 198 GO: 0008194 100
SLC35B3 200 271 144 200
100
SLC35B2 GO: 0031300 33 24 21 GO: 0008373 300 400
ST4GAL1 400 412 45
GALNT1 300 12 100
PIGH 200 0031228 9 45 GO: 200
ST3GAL6 100 11 0008375 300
ST6GALNAC3 GO: 400
ALG5 400 67
GALNT11 300 6 9 34 GO: 100
CHSY1 200 0098791 385 200
UGCG 100 GO: 0008376 300
MGAT5 15 Number of genes 400
ST3GAL1 400 Number of select 42
Rich factor(0-1)
PIGP 300 GO: 0009101 100
DPM1 316 200
ALG2 200 0031985 120 11 GO: 300
43
100
400
400
12 386 100
153 39 200
GO:
300
200
0005795
244
⁃lg P 100 400 300 GO: 0032580 94 11 22 37 37 GO: 0070085 100 400 300
[0,2] 200 100 103 225 225 300 200
[2,4] 400 GO: 0006667 GO: 0006486 400
[4,6] 300 200 GO: 0043413 300 200 100
[6,8] 100 400 300 200 100 400
[8,10] Ontology
[10,15] Biological process
[15,20] Cellular component
≥20 Molecular function
A:The heatmap of the top 20 upregulated and downregulated DEGRGs. B:The bubble diagram of GO analysis for DEGRGs. C:The circle diagram
of GO analysis for DEGRGs.
图1 糖基化相关差异表达基因及其功能富集分析
Figure 1 Differentially expressed glycosylation⁃related genes and their functional enrichment analysis

