


Page 70 - 南京医科大学自然版
P. 70
第44卷第9期
               ·1242 ·                           南 京    医 科 大 学 学         报                        2024年9月


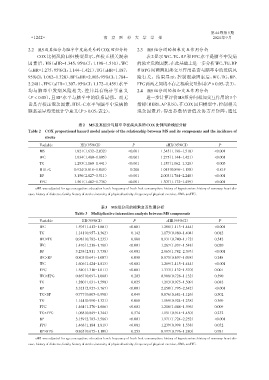
              2.2 MS及其组分与脑卒中发病关系的COX回归分析                        2.3  MS组分间的相乘交互作用分析
                  COX比例风险回归模型显示,在校正相关混杂                              表2显示WC、TG、BP和FPG水平是脑卒中发病
              因素后,MS(aHR=1.345,95%CI:1.198~1.510)、WC            的独立危险因素,在此基础上进一步分析WC、TG、BP
             (aHR=1.275,95%CI:1.144~1.421)、TG(aHR=1.187,        和FPG间两两相乘交互作用是否与脑卒中的发病风
              95%CI:1.062~1.328)、BP(aHR=2.003,95%CI:1.784~      险有关。结果显示,控制混杂因素后,WC、TG、BP、
              2.248)、FPG(aHR=1.307,95%CI:1.172~1.459)水平         FPG两两之间均不存之相乘交互作用(P > 0.05,表3)。
              均与脑卒中发病风险相关,差异具有统计学意义                             2.4  MS组分间的相加交互作用分析
             (P < 0.05),且 BP 水平与脑卒中的联系最强。而无                          进一步计算评价MS组分间相加交互作用的3个
              论是否校正混杂因素,HDL⁃C水平与脑卒中发病的                          指标(RERI、AP和S),在COX回归模型中,控制相关
              联系差异均无统计学意义(P > 0.05,表2)。                         混杂因素后,得出参数估计值及协方差矩阵,通过


                                     表2 MS及其组分与脑卒中发病关系的COX比例风险模型分析
              Table 2  COX proportional hazard model analysis of the relationship between MS and its components and the incidence of
                      stroke

                   Variable           HR(95%CI)               P               aHR(95%CI)              P
                   MS              1.821(1.632-2.032)       <0.001         1.345(1.198-1.510)       <0.001
                   WC              1.634(1.480-1.805)       <0.001         1.275(1.144-1.421)       <0.001
                   TG              1.293(1.160-1.441)       <0.001         1.187(1.062-1.328)        0.003
                   HDL⁃C           0.924(0.818-1.045)        0.208         1.015(0.896-1.150)        0.815
                   BP              3.150(2.827-3.511)       <0.001         2.003(1.784-2.248)       <0.001
                   FPG             1.561(1.402-1.738)       <0.001         1.307(1.172-1.459)       <0.001
                 aHR was adjusted for age,occupation,education level,frequency of fresh fruit consumption,history of hypertension,history of coronary heart dis⁃
              ease,history of diabetes,family history of stroke,intensity of physical activity,frequency of physical exercise,BMI,and TC.

                                                表3 MS组分间的相乘交互作用分析
                                    Table 3 Multiplicative interaction analysis between MS components
                   Variable            HR(95%CI)               P              aHR(95%CI)              P
                   WC               1.595(1.412-1.801)       <0.001        1.268(1.113-1.444)       <0.001
                   TG               1.141(0.957-1.362)        0.142        1.173(0.980-1.404)       0.082
                   WC×TG            0.983(0.782-1.235)        0.880        0.931(0.740-1.172)       0.542
                   WC               1.476(1.218-1.788)       <0.001        1.267(1.037-1.548)       0.020
                   BP               3.238(2.811-3.730)       <0.001        2.065(1.782-2.393)       <0.001
                   WC×BP            0.803(0.641-1.007)        0.058        0.875(0.697-1.098)       0.248
                   WC               1.606(1.424-1.813)       <0.001        1.269(1.115-1.444)       <0.001
                   FPG              1.540(1.310-1.811)       <0.001        1.333(1.132-1.570)       0.001
                   WC×FPG           0.867(0.697-1.080)        0.203        0.908(0.728-1.132)       0.390
                   TG               1.280(1.031-1.590)        0.025        1.213(0.975-1.509)       0.082
                   BP               3.321(2.927-3.767)       <0.001        2.050(1.795-2.342)       <0.001
                   TG×BP            0.777(0.605-0.998)        0.049        0.876(0.681-1.126)       0.302
                   TG               1.144(0.990-1.321)        0.068        1.069(0.924-1.238)       0.369
                   FPG              1.464(1.270-1.686)       <0.001        1.210(1.048-1.396)       0.009
                   TG×FPG           1.068(0.849-1.344)        0.574        1.151(0.914-1.450)       0.232
                   BP               3.159(2.783-3.586)       <0.001        1.971(1.724-2.252)       <0.001
                   FPG              1.468(1.184-1.819)       <0.001        1.239(0.998-1.538)       0.052
                   BP×FPG           0.865(0.675-1.109)        0.253        0.997(0.776-1.280)       0.981
                 aHR was adjusted for age,occupation,education level,frequency of fresh fruit consumption,history of hypertension,history of coronary heart dis⁃
              ease,history of diabetes,family history of stroke,intensity of physical activity,frequency of physical exercise,BMI,and TC.

