
Page 10 - 南京医科大学自然版
P. 10
第45卷第4期
·446 · 南 京 医 科 大 学 学 报 2025年4月
C
A B D E
H
F G I J
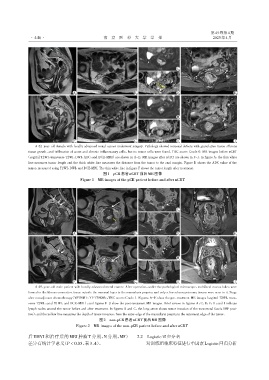
A 62⁃year⁃old female with locally advanced rectal cancer underwent surgery. Pathology showed mucosal defects with granulation tissue,fibrous
tissue growth,and infiltration of acute and chronic inflammatory cells,but no tumor cells were found. TRG score:Grade 0. MR images before nCRT
(sagittal T2WI,transverse T2WI,DWI,ADC,and DCE⁃MRI)are shown in A-E. MR images after nCRT are shown in F-J. In figure A,the thin white
line measures tumor length and the thick white line measures the distance from the tumor to the anal margin. Figure D shows the ADC value of the
tumor,measured using T2WI,DWI,and DCE⁃MRI. The thin white line in figure F shows the tumor length after treatment.
图1 pCR患者nCRT前后MR图像
Figure 1 MR images of the pCR patient before and after nCRT
C
A B D E
H
F G I J
A 49⁃year⁃old male patient with locally advanced rectal cancer. After operation,under the pathological microscope,multifocal mucus lakes were
formed in the fibrous connective tissue outside the mucosal layer to the muscularis propria,and only a few adenocarcinoma tissues were seen in it. Stage
after neoadjuvant chemotherapy(YPTNM):YP T3N0Mx,TRG score:Grade 1. Figures A-E show the pre⁃treatment MR images(sagittal T2WI,trans⁃
verse T2WI,axial T1WI,and DCE⁃MRI),and figures F-J show the post⁃treatment MR images. Brief arrows in figures A,C,D,F,H,and I indicate
lymph nodes around the tumor before and after treatment. In figures B and G,the long arrow shows tumor invasion of the mesorectal fascia(MF posi⁃
tive),and the yellow line measures the depth of tumor invasion,from the outer edge of the muscularis propria to the outermost edge of the tumor.
图2 non⁃pCR患者nCRT前后MR图像
Figure 2 MR images of the non⁃pCR patient before and after nCRT
后 EMVI 和治疗后的 MRI 肿瘤 T 分期、N 分期、MF) 2.2 Logistic回归分析
差异有统计学意义(P < 0.05,表3、4)。 对训练组临床特征进行单因素Logistic回归分析