Page 14 - 南京医科大学自然版
P. 14

第45卷第4期
               ·450 ·                            南 京    医 科 大 学 学         报                        2025年4月


               表5 nCRT疗效预测影响因素的单因素Logistic回归分析                   表6 nCRT疗效预测影响因素的多因素Logistic回归分析
              Table 5  Univariate logistic regression analysis of factors  Table 6  Multivariate logistic regression analysis of factors
                      influencing the prediction of nCRT efficacy       influencing the prediction of nCRT efficacy

                                 Univariate logistic regression analysis                    Multivariate logistic
                    Variable
                                      OR(95%CI)         P               Variable            regression analysis
               Age                01.007(0.974-1.042)  0.673                               OR(95%CI)       P
               Sex                01.692(0.716-3.999)  0.231     Post⁃tumor length(cm)  1.425(0.962-2.111)  0.077
               Tumor location     00.861(0.403-1.841)  0.699     Post⁃T                       NA           NA
               Tumor length(cm)                                  Post⁃EMD(cm)           9.885(2.136-45.734) 0.003
                Pre               01.374(0.984-1.917)  0.062     Pre⁃MF                 0.535(0.226-1.267)  0.155
                Post              01.743(1.139-2.666)  0.010     Pre⁃EMVI                     NA           NA
               T                                                 Post⁃LN count around tumor  1.400(0.969-2.023)  0.073
                Pre               01.836(0.683-4.936)  0.229        OR:odds ratio;NA:not included in the variable.
                Post              16.315(6.017-44.239)  <0.001
               N                                                          [8-9]
                                                                像学标志物         ,本研究综合考虑并研究了这些预测
                Pre               00.987(0.510-1.910)  0.969
                                                                因素,通过单因素及多因素 Logistic 回归分析表明,
                Post              01.831(0.917-3.658)  0.086
                                                                治疗后肿瘤壁外深度是nCRT后出现pCR的直肠癌
               EMD(cm)
                                                                患者的独立预测因素,在单因素及多因素Logistic回
                Pre               01.792(0.758-4.236)  0.184
                Post              57.010(7.115-456.780)  <0.001  归分析中,治疗后肿瘤壁外深度 OR 值较高,P 均<
               Pre⁃MF             05.225(1.688-16.178)  0.004   0.05。当治疗后壁外深度明显减小时,能有效预测
               Pre⁃EMVI           11.255(2.531-50.054)  0.001   nCRT 疗效,可协助临床制定治疗方案,实现为患者
               LN count around tumor                            个体化诊疗。
                Pre               01.069(0.925-1.237)  0.365         60%~70%的直肠癌患者在最初诊断时被分类
                Post              01.546(1.086-2.200)  0.016    为 T3 期,他们的 5 年生存率从 30%~80%不等,美国
               CEA(ng/mL)
                                                                国立综合癌症网络(National Comprehensive Cancer
                Pre               00.993(0.983-1.003)  0.170
                                                                Network,NCCN)临床实践指南建议所有 T3 期直肠
                Post              01.449(1.033-2.033)  0.032
                                                                癌患者均进行 nCRT,这已被越来越多的研究质疑
              离拟合。                                              其合理性。因此,区分将受益于 nCRT 的高风险 T3
                                                                期患者以及适合接受直接手术的低风险T3期患者是
              3  讨 论
                                                                个体化医学的关键。肿瘤壁外深度已被证明是
                                                                                             [10]
                  目前,临床研究中常用于 LARC 新辅助治疗效                       LARC局部复发的独立预测因素 。已有多项研究
              果预测的因子主要为临床特征、生物学标志物和影                            结果显示,肿瘤的T3亚阶段分期及肿瘤侵犯的壁外

                         A   1.0                                  B  1.0

                             0.8                                     0.8

                            Sensitivity  0.6                         Sensitivity  0.6

                                                                     0.4
                             0.4
                             0.2                                     0.2

                              0                                        0
                                   00  0.2  0.4  0.6  0.8  1.0              00  0.2  0.4  0.6  0.8  1.0
                                          1-Specificity                           1-Specificity
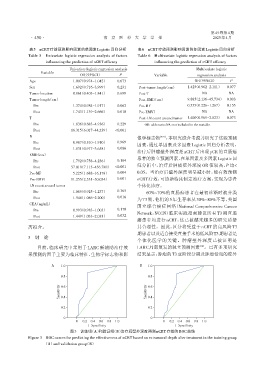
                                 图3   训练组(A)和验证组(B)治疗后壁外深度预测nCRT疗效的ROC曲线
              Figure 3  ROC curves for predicting the effectiveness of nCRT based on extramural depth after treatment in the training group
                     (A)and validation group(B)
   9   10   11   12   13   14   15   16   17   18   19