


Page 61 - 南京医科大学自然版
P. 61
第45卷第7期          李国花,蔡文玉,张登庆,等. 血色素结合蛋白与载脂蛋白B乘积对冠心病诊断价值的临床
                  2025年7月                研究[J]. 南京医科大学学报(自然科学版),2025,45(7):954-962,972                  ·959 ·


                                       表5 Hpx·apoB等指标与CAD风险的多因素Logistic回归分析
                         Table 5 Multivariate logistic regression analysis of Hpx·apoB and other indicators for risk of CAD

                                              Univariate model                         Multivariate model
                    Indicator
                                    OR            95%CI           P          OR            95%CI            P
                 Hpx·apoB           1.651       1.007-2.591      0.047       2.554       1.336-4.881      0.005
                 lg(Hpx)            1.482       0.833-2.638      0.181       1.301       0.652-2.595      0.774
                 apoB               1.012       0.997-1.028      0.119       0.995       0.967-1.024      0.792
                 Male               3.738       1.654-8.448      0.002       4.079       1.739-9.571      0.055
                 Smoking            2.429       1.033-5.710      0.042       2.424       0.984-5.974      0.659
                 Hyperlipidemia     2.577       1.157-5.738      0.020       1.694       0.670-4.285      0.353
                 Hb                 1.032       1.005-1.061      0.022       1.026       0.997-1.056      0.181
                 CRP                1.104       1.002-1.217      0.046       1.106       0.999-1.225      0.094
                 proBNP             1.002       1.000-1.004      0.028       1.002       1.000-1.003      0.056
                 Cr                 1.029       1.007-1.052      0.011       1.033       1.008-1.059      0.047


                    1.0                                                 1.0

                    0.8                                                 0.8


                  Sensitivity  0.6                                     Sensitivity  0.6

                    0.4
                                      Hpx·apoB
                                      CRP+LDL⁃C+proBNP+TnT              0.4                 Hpx·apoB+Cr
                                                                                            Framingham
                                      CRP+LDL⁃C+proBNP+TnT+Hpx·apoB
                    0.2               proBNP+TnT                        0.2                 Framingham+Hpx·apoB+Cr
                                      proBNP+TnT+Hpx·apoB                                   SCORE
                                      CRP+LDL-C
                                                                                            SCORE+Hpx·apoB+Cr
                     0                CRP+LDL-C+Hpx·apoB                  0
                       0            0.5           1.0                       0            0.5           1.0
                                     1-Specificity                                      1-Specificity
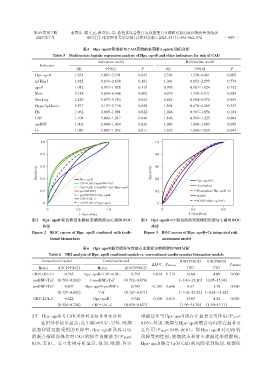
                图 2  Hpx·apoB 联合传统生物标志物预测冠心病的 ROC                 图3   Hpx·apoB+Cr联合风险预测模型预测冠心病的ROC
                     曲线                                                曲线
                Figure 2  ROC curves of Hpx·apoB combined with tradi⁃  Figure 3 ROC curves of Hpx·apoB+Cr integrated risk
                        tional biomarkers                                   assessment model

                                       表6 Hpx·apoB联合模型与传统心血管标志物模型的NRI分析
                        Table 6 NRI analysis of Hpx·apoB combined models vs. conventional cardiovascular biomarker models

                    Conventional model           Combined model                     NRI(95%CI)  IDI(95%CI)
                                                                       ΔAUC P (DeLong)                     P (NRI/IDI)
                   Model    AUC(95%CI)        Model        AUC(95%CI)                  (%)         (%)
                CRP+LDL⁃C+     0.785    Hpx·apoB+ CRP+LDL⁃    0.799    +0.014  0.719   14.60       4.00    0.060
                proBNP+TnT (0.702-0.868)  C+proBNP+TnT    (0.722-0.876)            (-3.40-28.10) (0.05-15.94)
                proBNP+TnT     0.807    Hpx·apoB+proBNP +     0.789    -0.180  0.646   4.67        1.70    0.360
                           (0.729-0.885)       TnT        (0.707-0.871)            (-7.03-23.12)(-0.01-11.82)
                 CRP+LDL⁃C     0.622        Hpx·apoB+         0.728    +0.106  0.015   15.63       4.82    0.030
                           (0.524-0.720)    CRP+LDL⁃C     (0.630-0.827)            (1.90-31.70) (1.50-15.71)


                2.5  Hpx·apoB与CAD风险的亚组异质性分析                       球滤过率与 Hpx·apoB 间存在显著交互作用(P 交互<
                    亚组分析结果显示,在年龄≥65 岁、男性、吸烟                       0.05),性别、吸烟与Hpx·apoB联合Cr间存在显著交

                状态和肾功能受损的亚组中,Hpx·apoB 及其与 Cr                      互作用(P 交互< 0.05,表 8)。即 Hpx·apoB 对 CAD 的
                的联合指标均保持对 CAD 的独立预测能力(P 趋势<                       风险受到性别、吸烟状态和肾小球滤过率的影响,
                0.05,表 8)。交互作用分析显示,性别、吸烟、肾小                       Hpx·apoB 联合 Cr 对 CAD 的风险受到性别、吸烟状

