


Page 133 - 南京医科大学自然版
P. 133
第45卷第8期          钱  哲,臧 攀,丁 磊,等. 高危前列腺癌患者穿刺病理预测模型的构建及验证研究[J].
                  2025年8月                  南京医科大学学报(自然科学版),2025,45(8):1186-1193,1210                    ·1189 ·


                                               表1 训练集和验证集中患者基线资料对比
                           Table 1 Comparison of clinical characteristics of the patients in the training and validation sets
                       Clinical characteristics       Training set(n=424)      Validation set(n=78)       P
                   Biopsy result[n(%)]                                                                   0.755
                     +                                 372(87.74)000-             70(89.74)0-
                     -                                  52(12.26)00-               8(10.26)0
                   Age[years,M(P25,P75)]                69(42,86)00               71(53,82)0.            0.409
                   PSA[ng/mL,M(P25,P75)]              11.62(0.31,155.00)        11.48(0.06,74.48)        0.161
                   PSAD[ng/mL ,M(P25,P75)]             0.34(0.02,6.21)0          0.37(0.00,2.86)         0.833
                             2
                   PI⁃RADS score[n(%)]                                                                   0.359
                     4                                 245(57.78)000-             50(64.10)0-
                     5                                 179(42.22)000-             28(35.90)0-
                   Lesions number[n(%)]                                                                  0.298
                     1                                 310(73.11)000-             62(79.49)0-
                     ≥2                                114(26.89)000-             16(20.51)0-
                   Histological region[n(%)]                                                             1.000
                     Peripheral zone                   222(52.36)000-             41(52.56)0-
                     Other                             202(47.64)000-             37(47.44)0-
                   Testosterone[ng/mL,M(P25,P75)]      9.98(0.00,35.71)         07.06(0.00,21.14)        0.041


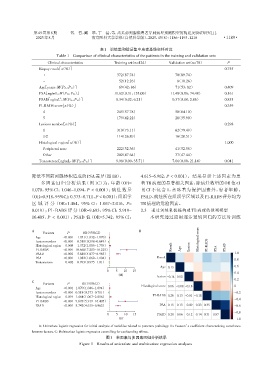
                降低不同前列腺体积造成的PSA差异(图1B)。                           4.615~6.962,P < 0.001)。结果显示上述因素为患
                    多因素回归分析结果(图 1C)为:年龄(OR=                       者TB病理的显著相关因素,除病灶数量的OR值<1
                1.070,95%CI:1.046~1.094,P < 0.001);病灶数量           且 CI 不包含 1,意味着为保护因素外,患者年龄、
               (OR=0.518,95%CI:0.373~0.711,P < 0.001);组织学         PSAD、病灶所在组织学区域以及PI⁃RADS评分均为
                区 域 评 分(OR=1.464,95% CI:1.067~2.016,P=            TB病理的危险因素。
                0.019);PI ⁃ RADS 评 分(OR=9.693,95% CI:5.919~       2.3  通过训练集数据构建TB病理的预测模型
                16.405,P < 0.001);PSAD 值(OR=5.742,95% CI:             本研究通过应用逐步逻辑回归的方法对训练


                A                                                B
                     Variants   P      OR(95%CI)
                 Age          <0.001 01.051(1.032-1.070)
                 Lesion number  <0.001 00.510(0.398-0.649)                                   Histological score
                 Histological region  0.008 01.372(1.085-1.739)                 Result  Lesion   PI⁃RADS
                 PI⁃RADS      <0.001 10.660(7.203-16.225)                           Age              PSA  PSAD
                 PSAD         <0.001 05.880(4.877-6.963)                                                     1.0
                 PSA          <0.001 01.082(1.062-1.104)                 Result                              0.8
                 Testosterone  0.402 00.993(0.975-1.01)
                                                                           Age  0.13                         0.6
                                                  0   5   10  15
                                                                                                             0.4
                                                        OR
                                                                         Lesion  -0.14  0.02
                                                                                                             0.2
                C                                                B
                     Variants   P      OR(95%CI)
                                                                  Histological score  0.06  -0.08  -0.18     0
                 Age          <0.001 1.070(1.046-1.094)
                 Lesion number  <0.001 0.518(0.373-0.711)                                                    -0.2
                 Histological region  0.019 1.464(1.067-2.016)          PI⁃RADS  0 0.26.26  0.13 -0.01  -0.18  -0.4
                 PI⁃RADS      <0.001 9.693(5.919-16.405)
                 PSAD         <0.001 5.742(4.615-6.962)                    PSA  0.15  0.13  -0.09 -0.23 0.35  -0.6
                                                                                                             -0.8
                                                   0   5  10  15          PSAD  0.20  0.06  -0.12 -0.14 0.31 0.87
                                                        OR                                                   -1.0
                   A:Univariate logistic regression for initial analysis of variables related to puncture pathology. B:Pearson’s coefficient characterising covariance
                between factors. C:Multivariate logistic regression controlling for confounding effects.
                                                  图1   单因素与多因素回归分析结果
                                      Figure 1  Results of univariate and multivariate regression analyses

