


Page 135 - 南京医科大学自然版
P. 135
第45卷第8期          钱  哲,臧 攀,丁 磊,等. 高危前列腺癌患者穿刺病理预测模型的构建及验证研究[J].
                  2025年8月                  南京医科大学学报(自然科学版),2025,45(8):1186-1193,1210                    ·1191 ·


                A                                                           B
                                            Full(AUC:0.856,95%CI:0.812-0.900)  1.00  High risk
                                            PSAD(AUC:0.783,95%CI:0.728-0.839)
                    1.0                                                        0.75  Low risk
                                            PI⁃RADS socre(AUC:0.697,95%CI:0.652-0.741)
                                            Age(AUC:0.613,95%CI:0.529-0.697)  Threshold  0.50
                    0.8
                                            Number of lesions(AUC:0.592,95%CI:0.519-0.664)  0.25
                                            Histological score(AUC:0.552,95%CI:0.479-0.625)
                   Sensitivity  0.6                                              0  0    100  Patient number 300  400
                                                                                               200
                    0.4
                    0.2
                     0
                      1.0  0.8  0.6  0.4  0.2  0
                             Specificity
                C                               D
                                                               0   10   20   30   40  50   60   70   80  90   100
                   40
                                                   Points
                  (%)  30                          Age
                  lmportance  20                   Lesion      406080
                                                                3 1
                   10
                                                                2
                    0                                          4 2
                       Age  Lesions  PI⁃RADS  PSAD  Histological score  13
                         Histological score        PI⁃RADS     4  5

                                                   PSAD
                                                               0  0.5  1.0  1.5  2.0  2.5 3.0  3.5  4.0  4.5 5.0  5.5  6.0  6.5
                                                   Total points
                                                               0  10  20  30  40  50  60  70  80  90 100 110 120 130
                                                   Risk
                                                                    0.10  0.50  0.90  0.99
                    E                                                 F    1.00
                                                 AUC:0.886,95%CI:0.776-0.995     High risk
                        1.0                                                0.75  Low risk
                                                                          Threshold  0.50
                        0.8                                                0.25
                       Sensitivity  0.6                                      0  0     20     40     60     80

                        0.4
                        0.2                                                             Patient number
                         0

                          1.0  0.8  0.6  0.4  0.2  0
                                 Specificity
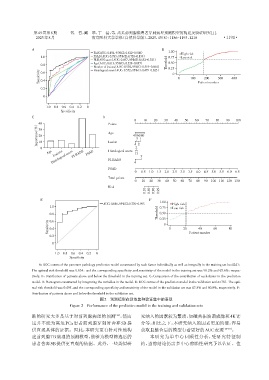
                   A:ROC curves of the puncture pathology prediction model constructed by each factor individually as well as integrally in the training set(n=424);
                The optimal risk threshold was 0.634,and the corresponding specificity and sensitivity of the model in the training set was 96.2% and 65.6%,respec⁃
                tively. B:Distribution of patients above and below the threshold in the training set. C:Comparison of the contribution of each factor in the prediction
                model. D:Nomogram constructed by integrating the variables in the model. E:ROC curves of the prediction model in the validation set(n=78). The opti⁃
                mal risk threshold was 0.495,and the corresponding specificity and sensitivity of the model in the validation set was 87.5% and 80.0%,respectively. F:
                Distribution of patients above and below the threshold in the validation set.
                                               图2   预测模型在训练集和验证集中的表现
                                 Figure 2  Performance of the predictive model in the training and validation sets
                断的研究大多是基于对前列腺病理的预测                    [21] ,然而    究纳入的因素较为繁琐,如磁共振波谱成像和4K评
                这并不能为高危 PCa 患者前列腺穿刺时舍弃 SB 提                       分等,相比之下,本研究纳入的因素更加简便,容易
                供直观具体的证据。因此,本研究更有针对性地构                            获取且整合后的模型有着更好的AUC表现                   [22-23] 。
                建前列腺TB病理的预测模型,能够为模型筛选后的                               本研究为单中心回顾性分析,受研究特征制
                患者舍弃SB提供更直观的依据。此外,一些类似研                           约,当前结论仍需多中心前瞻性研究予以佐证。值

