


Page 136 - 南京医科大学自然版
P. 136
第45卷第8期
               ·1192 ·                           南 京    医 科 大 学 学         报                        2025年8月


                表2 训练集和验证集中模型预测效率的相关统计指数                        得注意的是,按照本研究的目的,如果在高危患者
              Table 2  Statistical indices related to the predictive  中舍弃SB,有可能导致靶向病灶外更高级别的肿瘤
                       efficiency of the models in the training and
                                                                组织漏诊,从而导致术后格里森评分升级,这也是
                       validation sets
                                                                未来研究的方向。此外,可预见的是,人工智能等
                                     Training set  Validation set
                    Statistical indices                         新兴技术会进一步提高PCa穿刺前预测和诊断的效
                                     (n=424)      (n=78)
                                                                率。例如基于人工智能技术整合影像组学和病理
                Sensitivity(%)         65.600      80.000
                Specificity(%)         96.200      87.500       组学等多模态信息,通过大量数据高强度标记病
                                                                灶,提升对 PCa 病灶特征的解析能力,从而对可疑
                Positive predictive value(%) 99.200  98.200
                                                                PCa 病灶进行穿刺前诊断,这很可能成为 PCa 早期
                Negative predictive value(%) 28.100  33.300
                Positive likelihood ratio  17.054  06.400       筛查的新路径      [24-28] 。
                Negative likelihood ratio  00.358  00.229            本研究通过分析训练集中的患者数据构建了
                Diagnostic odds ratio  47.656      28.000       针对高危PCa患者TB病理诊断的预测模型,并通过


                      A            (Intercept)     B              Age          C         Histological score
                           0.08                        12.5
                                                                                  0.75
                                                       10.0
                           0.06
                          Density  0.04               Density  7.5                Density  0.50
                                                        5.0
                           0.02                         2.5                       0.25
                             0                           0                          0
                               -80 -60 -40 -20  0            0 0.05 0.10 0.15        -1   0    1   2
                                  Coefficient value          Coefficient value           Coefficient value
                      D              Lesion        E            PI⁃RADS        F            PSAD
                                                       0.5                         0.3
                            1.00
                                                       0.4                         0.2
                            0.75
                          Density  0.50                Density  0.3               Density  0.1
                                                       0.2
                            0.25                       0.1
                              0                          0                          0
                               -2   -1    0    1           0  5   10  15  20             5      10
                                  Coefficient value          Coefficient value          Coefficient value
                                        G
                                                   Mean AUC=0.846(95%CI:0.823-0.857)
                                                                   Mean=0.846
                                           Density 40     2.5%=0.823        97.5%=0.857


                                            20

                                             0
                                               0.75         0.80        0.85
                                                              AUC
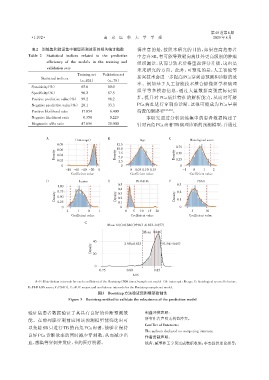
                 A-F:Distribution intervals for each coefficient of the Bootstrap(500 times)sample set model.(A:intercept ;B:age;C:histological score;D:lesion;
              E:PI⁃RADS score;F:PSAD). G:AUC means and confidence intervals for the Bootstrap sample set model.
                                              图3   Bootstrap方法验证预测模型稳健性
                                 Figure 3  Bootstrap method to validate the robustness of the prediction model


              验证集患者数据验证了其具有良好的诊断预测效                                 利益冲突声明:
              能。在前列腺穿刺前应用该预测模型能筛选出可                                 所有作者声明无利益冲突。
                                                                    Conflict of Interests:
              以免除 SB 只进行 TB 的高危 PCa 患者,能够在保持
                                                                    The authors declared no competing interests.
              良好 PCa 诊断效率的同时减少穿刺数,从而减少出                             作者贡献声明:
              血、感染等穿刺并发症,节约医疗资源。                                    钱哲、臧攀和王宇昊完成数据收集;李杰提供理论指导;

