
Page 10 - 《南京医科大学学报(自然科学版)》2025年第9期
P. 10
第45卷第9期
·1222 · 南 京 医 科 大 学 学 报 2025年9月
stained with 4′ ,6 ⁃ diamidino ⁃ 2 ⁃ phenylindole(Beyo⁃ crotonylation)to compare pan ⁃ PTM levels between
time,China). Cells were imaged under a spinning disk groups. To simultaneously analyze all examined sam⁃
conforcal microscope. ples(clinical normal ovarian and OC tissues)in paral⁃
1.3 Statistical analysis lel,we initially used dot blots for preliminary screen⁃
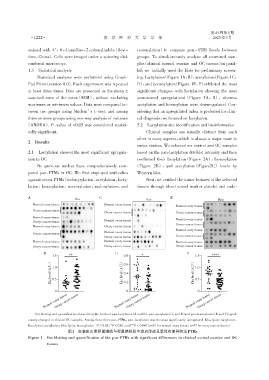
Statistical analyses were performed using Graph⁃ ing. Lactylation(Figure 1A,B),acetylation(Figure 1C,
Pad Prism(version 8.0). Each experiment was repeated D),and benzoylation(Figure 1E,F)exhibited the most
at least three times. Data are presented as the mean ± significant changes,with lactylation showing the most
standard error of the mean(SEM),without excluding pronounced upregulationd(Figure 1A,B),whereas
maximum or minimum values. Data were compared be⁃ acetylation and benzoylation were downregulated. Con⁃
tween two groups using Student’s t ⁃ test,and among sidering that an upregulated index is preferred for clini⁃
three or more groups using one⁃way analysis of variance cal diagnosis,we focused on lactylation.
(ANOVA). P⁃value of <0.05 was considered statisti⁃ 2.2 Lactylation site identification and bioinformatics
cally significant. Clinical samples are usually distinct from each
other in many aspects,which is always a major issue in
2 Results
omics studies. We selected six control and OC samples
2.1 Lactylation showed the most significant upregula⁃ based on the pan⁃lactylation dot⁃blot intensity and then
tion in OC confirmed their lactylation(Figure 2A),benzoylation
No previous studies have comprehensively com⁃ (Figure 2B),and acetylation(Figure2C)levels by
pared pan⁃PTMs in OC. We first employed antibodies Western blot.
against seven PTMs(isobutyrylation,acetylation,lacty⁃ Next,we verified the tumor features of the selected
lation,benzoylation,succinylation,malonylation,and tissues through blood vessel marker platelet and endo⁃
A C E
Kla Kac Kbz
Normal ovary tissue Normal ovary tissue
Normal ovary tissue
Ovary cancer tissue
Ovary cancer tissue Ovary cancer tissue
Normal ovary tissue
Normal ovary tissue Normal ovary tissue
Ovary cancer tissue
Ovary cancer tissue
Normal ovary tissue Ovary cancer tissue
Normal ovary tissue
Normal ovary tissue
Ovary cancer tissue
Ovary cancer tissue Ovary cancer tissue
Normal ovary tissue Normal ovary tissue Normal ovary tissue
Ovary cancer tissue Ovary cancer tissue Ovary cancer tissue
B D F
1.5 ** 0.8 * 1.5 ****
(A.U.) 1.0 (A.U.) 0.6 (A.U.) 1.0
Kla level 0.5 Kac level 0.4 Kbz level 0.5
0.2
0 0 0
Ovary cancer tissue
Ovary cancer tissue
Ovary cancer tissue
Normal ovary tissue Normal ovary tissue Normal ovary tissue
Dot blotting and quantification showed that the levels of pan⁃lactylation(A and B),pan⁃acetylation(C and D)and pan⁃benzoylation(E and F)signif⁃
icantly changed in clinical OC samples. Among these three pan⁃PTMs,pan⁃lactylation was the most significantly upregulated. Kla,lysine lactylation;
**
*
Kac,lysine acetylation;Kbz,lysine benzoylation. P < 0.05;P < 0.01,and *** P < 0.001(n=21 for normal ovary tissue,n=37 for ovary cancer tissue).
图1 在临床正常卵巢组织与卵巢癌组织中斑点印迹及量化有差异的泛PTMs
Figure 1 Dot blotting and quantification of the pan⁃PTMs with significant differences in clinical normal ovarian and OC
tissues