
Page 11 - 《南京医科大学学报(自然科学版)》2025年第9期
P. 11
第45卷第9期 苏 宁,曹 颖,张淑平,等. PARP1在K192位点的乳酸化抑制卵巢癌细胞的迁移和增殖[J].
2025年9月 南京医科大学学报(自然科学版),2025,45(9):1219-1228,1241 ·1223 ·
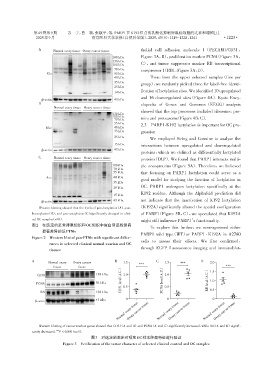
A thelial cell adhesion molecule 1(PECAM1/CD31,
Normal ovary tissue Ovary cancer tissue
Figure 3A,B),proliferation marker PCNA(Figure 3A,
180 kDa
130 kDa
100 kDa C),and tumor suppressor marker RB transcriptional
70 kDa corepressor 1(RB1,Figure 3A,D).
Kla 55 kDa
40 kDa Then,from the upper selected samples(five per
35 kDa
group),we randomly picked three for label⁃free identi⁃
25 kDa
fication of lactylation sites. We identified 10 upregulated
14 kDa
and 16 downregulated sites(Figure 4A). Kyoto Ency⁃
β⁃actin 43 kDa
B clopedia of Genes and Genomes(KEGG)analysis
Normal ovary tissue Ovary cancer tissue
showed that the top processes included ribosome,pro⁃
130 kDa
100 kDa
70 kDa tein,and proteasome(Figure 4B,C).
55 kDa 2.3 PARP1⁃K192 lactylation is important for OC pro⁃
Kbz 40 kDa
35 kDa gression
25 kDa
We employed String and Cormine to analyze the
15 kDa interactions between upregulated and downregulated
β⁃actin 43 kDa
proteins,which we defined as differentially lactylated
C Normal ovary tissue Ovary cancer tissue
proteins(DLP). We found that PARP1 interacts multi⁃
100kDa ple oncoproteins(Figure 5A). Therefore,we believed
70 kDa
55 kDa that focusing on PARP1 lactylation could serve as a
Ace 40 kDa
good model for studying the function of lactylation in
35 kDa
25 kDa OC. PARP1 undergoes lactylation specifically at the
K192 residue. Although the Alphafold prediction did
15 kDa
43 kDa not indicate that the inactivation of K192 lactylation
β⁃actin
Western blotting showed that the levels of pan⁃lactylation(A),pan⁃ (K192A)significantly altered the spatial configuration
benzoylation(B),and pan⁃acetylation(C)significantly changed in clini⁃ of PARP1(Figure 5B,C),we speculated that K192A
cal OC samples(n=6).
might still influence PARP1’s functionality.
图2 在选定的正常卵巢组织和OC组织中蛋白印迹检测有
To explore this further,we overexpressed either
显著差异的泛PTMs
PARP1 wild type(WT)or PARP1 ⁃ K192A in A2780
Figure 2 Western blot of pan⁃PTMs with significant differ-
cells to assess their effects. We first confirmed,
ences in selected clinical normal ovarian and OC
through EGFP fluorescence imaging and immunoblot⁃
tissues
A Normal ovary Ovary cancer B 1.5 C 1.5 D 2.0
*** ***
tissue tissue ***
(A.U.) (A.U.) 1.5
CD31 130 kDa 1.0 1.0 (A.U.)
PCNA 36 kDa level PCNA level RB level 1.0
CD31 0.5 0.5 0.5
RB 130 kDa
β⁃actin 43 kDa 0 0 0
Ovary cancer tissue
Normal ovary tissue Normal ovary tissue Normal ovary tissue
Ovary cancer tissue
Ovary cancer tissue
Western blotting of cancer marker genes showed that CD31(A and B)and PCNA(A and C)significantly increased,while RB(A and D)signifi⁃
cantly decreased. *** P < 0.001(n=5).
图3 对选定的临床对照和OC样本肿瘤特征进行验证
Figure 3 Verification of the tumor character of selected clinical control and OC samples