
Page 12 - 《南京医科大学学报(自然科学版)》2025年第9期
P. 12
第45卷第9期
·1224 · 南 京 医 科 大 学 学 报 2025年9月
A B Kla KEGG pathway enrichment
Top 20 of KEGG enrichment
OC Control Ribosome 17(0.000 47)
338 74 294 Protein processing in endoplasmic reticulum 18(0.000 49)
Focal adhesion 20(0.000 49)
Complement and coagulation cascades 12(0.001 5)
Endocrine and other factor⁃regulated calcium reabsorption 9(0.002)
Salmonella infection 19(0.003)
Prion diseases 7(0.000 2)
UP Carbon metabolism 13(0.003 4)
10 P value
ECM⁃receptor interaction 11(0.003 4)
16 Proteoglycans in cancer 17(0.008 6) 0.03
Down 0.02
Adherens junction 9(0.009)
Bacterial invasion of epithelial cells 9(0.014) 0.01
C 2 Amoebiasis 14(0.025)
SPTBN1 Pathogenic Escherichia coli infection 19(0.027)
PTGIS 1 Spliceosome 12(0.029)
DNAH11 RNA transport 13(0.002)
EPB41L2 0 Necroptosis 13(0.033)
DST
Platelet activation 11(0.034)
FN1 -1 Antigen processing and presentation 8(0.034)
CCDC178 5(0.009)
DNAH17 -2 Citrate cycle(TCA cycle)
GNAL 0 3 6 9
TRIM28 Gene percent(%)
TTN
ANXA6
RPS23
SAMHD1
PARP1
C6
VPS13C
FPR1
HSPA1A
HSPA4
SMCHD1
APEX1
SEC24B
CTR1 CTR2 CTR3 OC1 OC2 OC3
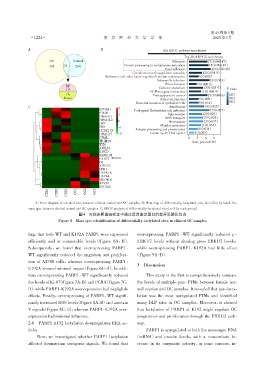
A:Venn diagram of selected sites between clinical control and OC samples. B:Heat map of differentially⁃lactylated sites identified by label⁃free
mass spec between clinical control and OC samples. C:KEGG analysis of differentially⁃lactylated sites(n=3 for each group).
图4 在临床卵巢癌样本中通过质谱鉴定蛋白的差异乳酸化位点
Figure 4 Mass spec identification of differentially⁃lactylated sites in clinical OC samples
ting,that both WT and K192A PARP1 were expressed overexpressing PARP1 ⁃ WT significantly reduced p ⁃
efficiently and at comparable levels(Figure 6A,B). ERK1/2 levels without altering gross ERK1/2 levels,
Subsequently,we found that overexpressing PARP1 ⁃ while overexpressing PARP1 ⁃ K192A had little effect
WT significantly reduced the migration and prolifera⁃ (Figure 9A-D).
tion of A2780 cells,whereas overexpressing PARP1⁃
3 Discussion
K192A showed minimal impact(Figure 6C-F). In addi⁃
tion,overexpressing PARP1 ⁃ WT significantly reduced This study is the first to comprehensively compare
the levels of Ki⁃67(Figure 7A,B)and PCNA(Figure 7C, the levels of multiple pan⁃PTMs between female nor⁃
D),while PARP1⁃K192A overexpression had negligible mal ovarian and OC samples. It revealed that pan⁃lacty⁃
effects. Finally,overexpressing of PARP1 ⁃ WT signifi⁃ lation was the most upregulated PTMs and identified
cantly increased ROS levels(Figure 8A,B)and annexin many DLP sites in OC samples. Moreover,it showed
V signals(Figure 8C,D),whereas PARP1⁃K192A over⁃ that lactylation of PARP1 at K192 might regulate OC
expression had minimal influence. progression and proliferation through the ERK1/2 path⁃
2.4 PARP1 K192 lactylation downregulates ERK ac⁃ way.
tivity PARP1 is upregulated at both the messenger RNA
Next,we investigated whether PARP1 lactylation (mRNA)and protein levels,with a concomitant in⁃
affected downstream oncogenic signals. We found that crease in its enzymatic activity,in some cancers,in⁃