
Page 68 - 《南京医科大学学报(自然科学版)》2025年第9期
P. 68
第45卷第9期
·1280 · 南 京 医 科 大 学 学 报 2025年9月
(续表1)
Variable CTD⁃nonPAH(n=95) CTD⁃PAH(n=52) P
Haemorrhages[n(%)] 0 0.200
None 52(54.7)0000 0.027(51.9)
1-2 loops/nailfold 33(34.7)0000 0.015(28.8)
3-6 loops/nailfold 9(9.5)0000 0.006(11.5)
≥7 loops/nailfold 1(1.1)0000 0.004(7.8)
Subpapillary venous plexus visibility[n(%)] 0.593
Not visible 64(67.4)0000 0.035(67.3)
1 row visible 17(17.9)0000 0.008(15.4)
2 row visible 10(10.5)0000 0.008(15.4)
>2 rows,dilated 4(4.2)0000 0.001(1.9)
Morphology score[M(P25,P75)] 2.00(1.15,5.05)0 02.70(1.15,5.50) 0.331
Flow pattern score[M(P25,P75)] 0.60(0.20,2.60)0 00.80(0.20,2.60) 0.390
Pericapillary score[M(P25,P75)] 1.90(0.40,2.80)0 02.40(0.80,3.92) 0.039
Semi⁃quantitative assessment[n(%)] 0.762
Normal 7(7.4)0000 0.003(5.8)
Essentially normal 9(9.5)0000 0.003(5.8)
Mild abnormal 27(28.4)0000 0.012(23.1)
Major abnormal 26(27.4)0000 0.015(28.8)
Severe abnormal 26(27.4)0000 0.019(36.5)
CTD:connective tissue disease;SLE:systemic lupus erythematosus;SS:Sjögren’s syndrome;SSc:systemic sclerosis;RA:rheumatoid arthritis;
OCTD:undifferentiated connective tissue disease;MCTD:mixed connective tissue disense;PVR:pulmonary vascular resistance;CO:cardiac output;CI:
cardiac index;mRAP:mean right atrial pressure;SvO2:venous oxyhaemoglobin saturation;RBC aggregation:red blood cell aggregation.
表2 Logistic回归分析CTD患者发生PAH危险因素
Table 2 Logistic regression analysis of risk factors for the development of PAH in patients with CTD
Variable β OR 95%CI P
Disease type(SSc/MCTD) 0.883 2.419 0.880-6.646 0.087
Capillary loop length(per 50 μm increase) 0.006 1.300 1.100-1.500 0.005
Pericapillary score 0.237 1.268 1.025-1.568 0.029
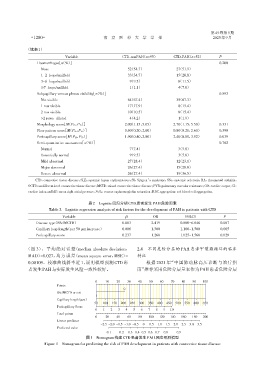
(图 3)。平均绝对误差(median absolute deviation, 2.4 不同危险分层的 PAH 患者甲襞微循环的临床
MAD)=0.027,均方误差(mean square error,MSE)= 特征
0.00109。校准曲线斜率近 1,说明模型预测 CTD 患 根据 2021 年“中国肺动脉高压诊断与治疗指
者发生PAH与实际发生风险一致性较好。 南”推荐采用危险分层量表作为PAH患者危险分层
0 10 20 30 40 50 60 70 80 90 100
Points
0
SSc/MCTD or not
1
Capillary length(μm)
50 100 150 200 250 300 350 400 450 500 550 600 650
Pericapillary Score
0 1 2 3 4 5 6 7 8 9 10
Total points
0 20 40 60 80 100 120 140 160 180 200
Linear predictor
-2.5 -2.0 -1.5 -1.0 -0.5 0 0.5 1.0 1.5 2.0 2.5 3.0 3.5
Predicted value
0.1 0.2 0.3 0.4 0.5 0.6 0.7 0.8 0.9
图1 Nomogram构建CTD患者发生PAH风险预测模型
Figure 1 Nomogram for predicting the risk of PAH development in patients with connective tissue disease