


Page 100 - 南京医科大学自然版
P. 100
第46卷第10期
               ·1530 ·                           南 京    医 科 大 学 学         报                        2026年10月


                                                                  B             C             D


                                                     A            E             F             G


                                                 H                      I                     J
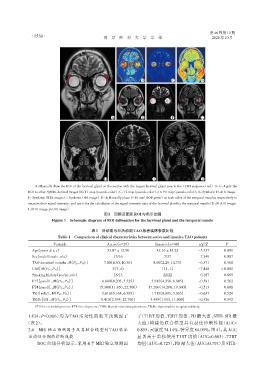
                 A:Manually draw the ROI of the lacrimal gland on the section with the largest lacrimal gland area in the T2WI sequence(red). B-G:Apply the
              ROI to other SyMRI⁃derived images[B:T1 map(pseudo⁃color);C:T2 map(pseudo⁃color);D:PD map(pseudo⁃color);E:Synthetic FLAIR image;
                                                                    2
              F:Synthetic STIR image;G:Synthetic DIR image]. H-J:Manually place 5-10 mm ROI(green)on both sides of the temporal muscles respectively to
              measure their signal intensity,and use it for the calculation of the signal intensity ratio of the lacrimal gland to the temporal muscle(H:FLAIR image;
              I:STIR image;J:DIR image).
                                                 图1   泪腺及颞肌ROI勾画示意图
                         Figure 1 Schematic diagram of ROI delineation for the lacrimal gland and the temporal muscle

                                           表1 活动期与非活动期TAO患者临床参数比较
                            Table 1 Comparison of clinical characteristics between active and inactive TAO patients

                                                                                               2
                          Variable                 Active(n=29)          Inactive(n=44)      t/χ /Z      P
                Age(years,x ± s)                   53.07 ± 12.50         42.16 ± 14.25       -3.357      0.001
                Sex(male/female,n/n)                  13/16                  7/37             7.349      0.007
                TAO duration[months,M(P25,P75 )]  7.00(4.50,10.50)      8.00(2.25,14.75)     -0.571      0.568
                CAS[M(P25,P75 )]                     3(3,4)                 1(1,1)           -7.448    < 0.001
                Smoking history(yes/no,n/n)           16/13                 22/22             0.187      0.665
                FT3[pmol/L,M(P25,P75 )]         4.840(4.205,5.525)     5.015(4.258,6.045)    -0.581      0.562
                FT4[pmol/L,M(P25,P75 )]        15.300(11.850,22.500)  17.200(14.200,19.300)  -0.513      0.608
                TSH[mU/L,M(P25,P75 )]           1.610(0.168,6.305)     1.715(0.095,3.005)    -0.637      0.524
                TRAb[U/L,M(P25,P75 )]           5.410(2.595,12.700)   5.455(1.913,11.800)    -0.536      0.592
                 FT3:free triiodothyronine;FT4:free thyroxine;TSH:thyroid⁃stimulating hormone;TRAb:thyrotrophin receptor antibody.
              1.834,P=0.006)均为 TAO 活动性的独立预测因子                   子(T1RT 均值、T2RT 均值、PD 最大值、STIR⁃SIR 最
             (表2)。                                              大值)构建的联合模型具有最佳诊断性能(AUC=

              2.4  MRI 独立预测因子及其联合模型对 TAO 临床                     0.855,灵敏度74.14%,特异度84.09%,图4),其AUC
              活动性分期的诊断效能                                        显著高于单独使用 T1RT 均值(AUC=0.663)、T2RT
                  ROC 曲线分析显示,采用 4 个 MRI 独立预测因                   均值(AUC=0.725)、PD最大值(AUC=0.707)及STIR⁃

