


Page 84 - 南京医科大学自然版
P. 84
第46卷第10期
               ·1514 ·                           南 京    医 科 大 学 学         报                        2026年10月


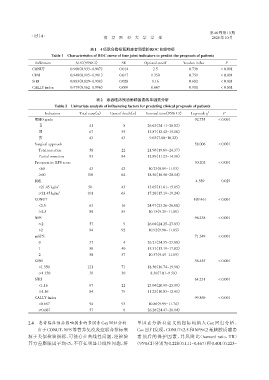
                                           表1 4项联合指标预测患者预后的ROC曲线特征
                         Table 1 Characteristics of ROC curve of four joint indicators to predict the prognosis of patients

                 Indicators         AUC(95%CI)           SE         Optimal cutoff   Youden index        P
                CONUT             0.960(0.933-0.987)    0.014           2.5             0.730          < 0.001
                GINI              0.948(0.915-0.981)    0.017          1 350            0.751          < 0.001
                SIRI              0.883(0.829-0.938)    0.028          1.16             0.682          < 0.001
                CALLY index       0.979(0.962-0.996)    0.009          0.667            0.901          < 0.001

                                             表2 患者临床预后影响因素的单因素分析
                          Table 2 Univariate analysis of influencing factors for predcting clinical prognosis of patients
                      Indicators      Total case(n)  Case of death(n)  Survival time(95% CI)  Log⁃rank χ 2  P
                 WHO grade                                                                 92.755     < 0.001
                   Ⅱ                     041             08          26.63(24.11-28.02)
                   Ⅲ                     067             55          13.87(12.42-15.16)
                   Ⅳ                     043             43           9.03(7.80-10.22)
                 Surgical approach        0                                                38.006     < 0.001
                   Total resection       058             22          21.96(19.69-24.37)
                   Partial resection     093             84          12.89(11.23-14.18)
                 Preoperative KPS score   0                                                30.202     < 0.001
                   <60                   043             42           10.23(8.89-11.93)
                   ≥60                   108             64          18.56(16.58-20.14)
                 BMI                      0                                                4.589       0.029
                            2
                   <21.45 kg/m            50             43          13.65(11.61-15.05)
                   ≥21.45 kg/m 2         101             63          17.28(15.19-19.24)
                 CONUT                                                                    109.461     < 0.001
                   <2.5                  063             16          24.97(23.26-26.68)
                   ≥2.5                  088             85           10.15(9.29-11.00)
                 NPS                      0                                                96.238     < 0.001
                   ≤2                    057             09          26.04(24.25-27.83)
                   >2                    094             92           10.92(9.98-11.85)
                 mGPS                     0                                                71.349     < 0.001
                   0                     037             04          26.21(24.55-27.88)
                   1                     056             40          15.51(13.19-17.82)
                   2                     058             57           10.57(9.49-11.65)
                 GINI                                                                      56.455     < 0.001
                   <1 350                121             71          18.36(16.74-19.98)
                   ≥1 350                030             30           8.30(7.01-9.59)
                 SIRI                                                                      64.231     < 0.001
                   <1.16                 067             22          23.04(20.99-25.09)
                   ≥1.16                 084             79          11.22(10.03-12.41)
                 CALLY index                                                               99.869     < 0.001
                   <0.667                094             93           10.86(9.99-11.74)
                   ≥0.667                057             08          26.26(24.47-28.04)


              2.4  患者临床预后影响因素的多因素Cox回归分析                        单因素分析有意义的指标均纳入 Cox 回归分析。
                  由于CONUT、NPS等营养免疫炎症联合指标来                       Cox 回归发现,CONUT<2.5 和 NPS≤2 是脑胶质瘤患
              源于类似检验指标,可能存在共线性问题,经检验                            者预后的保护因素,其风险比(harzard ratio,HR)
              其方差膨胀因子均<5,不存在明显共线性问题,将                          (95%CI)分别为0.228(0.111~0.467)和0.401(0.223~

