Page 114 - 《南京医科大学学报(自然科学版)》2026年第3期
P. 114

第46卷第3期
               ·422 ·                            南 京    医 科 大 学 学         报                        2026年3月


                      A        48   46    45   26    1           B       49 49 49 49 47 46 45 44 35 28 18 10 3
                          10                                          1.5
                           5
                        Coefficients  -5 0                           Binomial deviance  1.4


                         -10                                          1.3
                                                                      1.2
                         -15
                               -10  -8    -6   -4   -2                     -10   -8   -6    -4   -2
                                       log(λ)                                      log(λ)
                      C                                         D
                         10                                               LASSO          Boruta
                        Importance  5                                   G -      CHD
                                                                                 Age
                                                                     Hemoglobin
                         0
                                                                               Creatinine
                                                                      APTT    Urea nitrogen  Temperature
                        -5                                          Serum sodium  D⁃dimer
                                                                    Total bilirubin  Procalcitonin
                                     x.cl
                                    x.hr
                                      x.mn
                                        x.vis
                                       x.plt
                                                 x.pri
                                                x.ca
                                                    x.chd
                                                      x.cre
                                                     x.age
                                          x.G
                                         x.ne
                                           x.ly
                                               x.alb
                                            x.fib
                                   x.sbp
                              x.bg
                             x.mv
                            ShadowMin  x.cancer  x.stroke  shadowMean  x.wbc  x.other  x.sofa  x.aptt
                                  x.alt
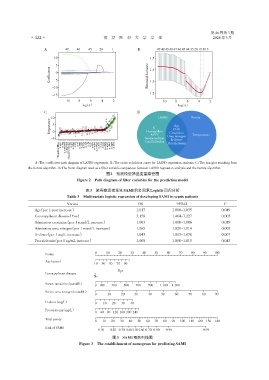
                 A:The coefficient path diagram of LASSO regression. B:The cross⁃validation curve for LASSO regression analysis. C:The box plot resulting from
              the Boruta algorithm. D:The Venn diagram used as a filter variable comparison between LASSO regression analysis and the Boruta algorithm.
                                                  图2 预测模型筛选变量路径图
                                    Figure 2 Path diagram of filter variables for the prediction model
                                         表3 脓毒症患者发生SAMI的多因素Logistic回归分析
                                Table 3 Multivariate logistic regression of developing SAMI in sepsis patients
                                Variate                          OR                95%CI                P
                 Age(per 1⁃year increase)                       1.017            1.000-1.035           0.049
                 Coronary heart disease(Yes)                    3.158            1.464-7.227           0.005
                 Admission creatinine(per 1 μmol/L increase)    1.003            1.000-1.006           0.089
                 Admission urea nitrogen(per 1 mmol/L increase)  1.065           1.021-1.114           0.005
                 D⁃dimer(per 1 mg/L increase)                   1.043            1.013-1.078           0.007
                 Procalcitonin(per 1 ng/mL increase)            1.008            1.000-1.015           0.043
                                             0    10    20   30    40   50    60    70   80    90   100
                      Points
                      Age(years)
                                            10  30  50  70  90
                                                       Yes
                      Coronary heart disease
                                            No
                      Serum creatinine(μmol/L)
                                             0 100  300   500   700  900   1 100  1 300
                      Serum urea nitrogen(mmol/L)
                                             0     10    20    30    40    50     60    70    80    90
                      D⁃dimer(mg/L)          0   10  20  30  40
                      Procalcitonin(mg/L)
                                             0  40 80 120 160 200 240
                      Total points
                                             0  10  20  30  40  50  60  70  80  90  100  110  120  130 140
                      Risk of SAMI
                                              0.10  0.20 0.30 0.40 0.50 0.60 0.70 0.80  0.90   0.99
                                                     图3 SAMI预测列线图
                                      Figure 3  The establishment of nomogram for predicting SAMI
   109   110   111   112   113   114   115   116   117   118   119