


Page 104 - 南京医科大学自然版
P. 104
第46卷第7期
               ·1050 ·                           南 京    医 科 大 学 学         报                        2026年7月


              0.80 较宽阈值区间内,融合模型的净获益持续高于                        (11.3%)、irAE 11例(17.7%)、≥Ⅲ级严重并发症11例
              其他模型,也优于“全部干预/全部不干预”两种极端                         (17.7%)。irAE 中位发生时间达 56(47,67)d,明显
              策略,其临床实用性由此得到量化印证(图3)。                            晚于感染性并发症[17(10,26)d;Mann⁃Whitney U
              2.3  免疫联合治疗相关并发症发生情况                              检验,P < 0.001],这也就意味着若沿用 30 d 观察
                  把观察窗由30 d扩展至90 d之后,全组共20例                     窗,半数以上的免疫相关事件将被遗漏                   [16-17] 。融合
             (32.3%)发生Clavien⁃Dindo ≥Ⅱ级并发症,其中感染                 模型对≥Ⅱ级并发症的验证集 AUC 为 0.803(95%
              性 并 发 症 12 例(19.4%)、消 化 系 统 并 发 症 7 例             CI:0.591~0.995),对≥Ⅲ级严重并发症的 AUC 为


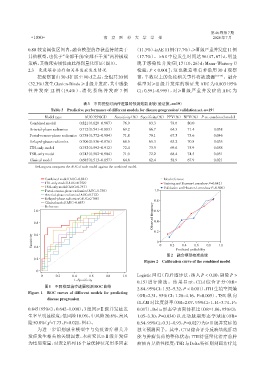
                                        表3 不同模型对治疗进展的预测效能比较(验证集,n=19)
                         Table 3 Predictive performance of different models for disease progression(validation set,n=19)
                      Model type        AUC(95%CI)    Sensitivity(%) Specificity(%) PPV(%)  NPV(%) P vs. combined model
               Combined model         0.821(0.629-0.987)  76.9        83.3      78.6    80.0         -
               Arterial⁃phase radiomics  0.712(0.541-0.883)  69.2     66.7      64.3    71.4        0.038
               Portal⁃venous⁃phase radiomics 0.738(0.572-0.904)  71.8  70.1     67.5    73.6        0.046
               Delayed⁃phase radiomics  0.706(0.536-0.876)  68.5      65.3      63.2    70.8        0.035
               ITH⁃only model         0.752(0.592-0.912)  72.4        73.5      69.6    75.9        0.058
               TSR⁃only model         0.743(0.582-0.904)  71.0        72.2      68.4    74.5        0.051
               Clinical model         0.685(0.513-0.857)  64.8        62.4      58.9    67.9        0.021
                 DeLong test compares the AUC of each model against the combined model.

                      Combined model(AUC=0.821)                              Ideal reference
                      ITH⁃only model(AUC=0.752)                              Training set(Hosmer⁃Lemeshow P=0.642)
                      TSR⁃only model(AUC=0.743)                              Validation set(Hosmer⁃Lemeshow P=0.508)
                      Portal⁃venous⁃phase radiomics(AUC=0.738)          1.0
                      Arterial⁃phase radiomics(AUC=0.712)
                      Delayed⁃phase radiomics(AUC=0.706)
                                                                        Observed frequency 0.8
                      Clinical model(AUC=0.685)
                      Reference
                 1.0                                                    0.6

                 0.8                                                    0.4
                                                                        0.2
                Sensitivity                                              0 00   0.2  0.4   0.6  0.8   1.0
                 0.6

                 0.4
                                                                                  Predicted probability
                                                                              图2   融合模型校准曲线
                                                                    Figure 2 Calibration curve of the combined model
                 0.2

                  0
                   00      0.2    0.4     0.6     0.8     1.0   Logistic 回归(向后逐步法,纳入 P < 0.10,剔除 P >
                                   1-Specificity
                                                                0.15)进行筛选。结果显示,CTId 综合评分(OR=
                      图1  不同模型治疗进展预测ROC曲线                       2.84,95%CI:1.52~5.32,P < 0.001)、ITH生境空间熵
              Figure 1  ROC curves of different models for predicting  (OR=2.31,95% CI:1.28~4.16,P=0.005)、TSR 纵 向
                       disease progression
                                                                GLCM 对比度斜率(OR=2.07,95%CI:1.14~3.74,P=
              0.845(95%CI:0.642~1.000);3 组间≥Ⅱ级并发症发              0.017)、Delta 形态学表面体积比(OR=1.86,95%CI:
              生率呈明显梯度:低风险10.0%、中风险20.8%、高风                      1.05~3.30,P=0.034)以及动脉期形态学球度(OR=
              险50.0%(χ =7.73,P=0.021,图4)。                       0.54,95%CI:0.31~0.93,P=0.027)为≥Ⅱ级并发症的
                        2
                  为进一步识别融合模型中与免疫治疗相关并                           独立预测因子。其中,CTId综合评分反映基线肝功
              发症发生相关的关键因素,本研究以≥Ⅱ级并发症                            能与肿瘤负荷的整体状态;ITH 特征量化治疗前肿
              为结局变量,对表2所列16个最优特征采用多因素                           瘤瘤内异质性程度;TSR与Delta特征则刻画治疗过

