


Page 19 - 南京医科大学自然版
P. 19
第46卷第9期      万玉姣,纪大鹏,袁玉洁,等. 呼吸事件相关的血氧饱和度下降速率与2型糖尿病及其血管并发症的
                  2026年9月              相关性研究[J]. 南京医科大学学报(自然科学版),2026,46(9):1286-1293                   ·1289 ·


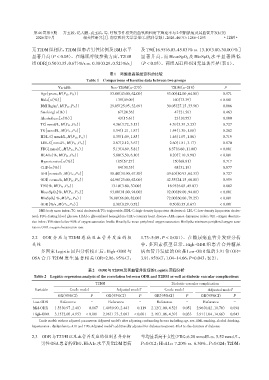
                无T2DM组相比,T2DM组患者男性比例及BMI水平                        及 T90[16.95(6.03,45.03)% vs. 13.10(3.80,30.00)%]
                显著升高(P < 0.05)。在睡眠呼吸参数方面,T2DM                     显著升高,而 MeanSpO2 及 MinSpO2 水平显著降低
                组ODR[0.50(0.35,0.67)%/s vs. 0.38(0.29,0.52)%/s]  (P < 0.05)。两组AHI和ODI无显著差异(表1)。
                                                    表1  两组患者基线资料的比较
                                         Table 1 Comparisons of baseline data between two groups

                            Variable                Non⁃T2DM(n=275)             T2DM(n=218)              P
                    Age[years,M(P25,P75 )]          53.00(43.00,62.00)        53.00(42.00,64.00)        0.971
                    Male[n(%)]                         135(49.09)                160(73.39)            < 0.001
                    BMI[kg/m ,M(P25,P75 )]          29.05(25.95,32.69)        30.05(27.15,33.96)        0.006
                           2
                    Smoking[n(%)]                      67(24.36)                  47(21.56)             0.463
                    Alcohol use[n(%)]                  43(15.61)                  23(10.55)             0.100
                    TC[mmol/L,M(P25,P75 )]           4.36(3.72,5.15)           4.39(3.39,5.23)          0.727
                    TG[mmol/L,M(P25,P75 )]           1.54(1.21,1.87)           1.54(1.30,1.88)          0.282
                    HDL⁃C[mmol/L,M(P25,P75 )]        1.35(1.09,1.85)           1.46(1.07,1.86)          0.719
                    LDL⁃C[mmol/L,M(P25,P75 )]        2.67(2.12,3.67)           2.60(1.81,3.17)          0.070
                    FBG[mmol/L,M(P25,P75 )]          5.13(4.69,5.81)           8.37(6.60,11.00)        < 0.001
                    HbA1c[%,M(P25,P75 )]             5.80(5.50,6.10)           8.20(7.10,9.90)         < 0.001
                    Hypertension[n(%)]                 185(67.27)                150(68.81)             0.717
                    CHD[n(%)]                          84(30.55)                  68(31.19)             0.877
                    AHI[events/h,M(P25,P75 )]       50.40(30.90,67.50)        49.40(30.93,64.33)        0.727
                    ODI[events/h,M(P25,P75 )]       44.90(23.00,62.00)        42.55(24.15,60.00)        0.959
                    T90[%,M(P25,P75 )]              13.10(3.80,30.00)         16.95(6.03,45.03)         0.002
                    MeanSpO2 [%,M(P25,P75 )]        93.00(91.00,94.00)        92.00(89.00,94.00)       < 0.001
                    MinSpO2 [%,M(P25,P75 )]        76.00(66.00,82.00)         72.00(60.00,79.25)       < 0.001
                    ODR[%/s,M(P25,P75 )]             0.38(0.29,0.52)           0.50(0.35,0.67)         < 0.001
                   BMI:body mass index;TC:total cholesterol;TG:triglyceride;HDL⁃C:high⁃density lipoprotein cholesterol;LDL⁃C:low⁃density lipoprotein choles⁃
                terol;FBG:fasting blood glucose;HbA1c:glycosylated hemoglobin;CHD:coronary heart disease;AHI:apnea⁃hypopnea index;ODI:oxygen desatura⁃
                tion index;T90:time below 90% of oxygen saturation levels;MeanSpO2:mean peripheral oxygen saturation;MinSpO2:minimum peripheral oxygen satu⁃
                ration;ODR:oxygen desaturation rate.

                2.2  ODR 分层与 T2DM 患病及血管并发症的相                      1.73~5.09,P < 0.001)。在糖尿病血管并发症分析
                关性                                                中,多因素模型显示,High⁃ODR 组患者合并糖尿
                    多因素 Logistic 回归分析校正后,High⁃ODR 与               病血管并发症的 OR 是 Low⁃ODR 组的 3.91 倍(OR=
                OSA 合并 T2DM 发生显著相关(OR=2.96,95%CI:                 3.91,95%CI:1.04~14.66,P=0.043,表2)。

                                          表2 ODR与T2DM及其血管并发症的Logistic回归分析
                 Table 2  Logistic regression analysis of the correlation between ODR and T2DM as well as diabetic vascular complications
                                             T2DM                               Diabetic vascular complication
                 Variable        Crude model           Adjusted model a      Crude model         Adjusted model b
                            OR(95%CI)      P      OR(95%CI)      P      OR(95%CI)      P      OR(95%CI)      P
                Low⁃ODR      Reference     -       Reference     -       Reference     -       Reference     -
                Mid⁃ODR   1.53(0.97,2.40)  0.067  1.49(0.90,2.44)  0.119  2.12(1.00,4.52) 0.051  2.96(0.82,10.70)  0.098
                High⁃ODR  3.15(2.00,4.95) < 0.001  2.96(1.73,5.09) < 0.001  2.16(1.06,4.39) 0.033  3.91(1.04,14.66)  0.043
                   Crude model:without adjusted parameters;Adjusted model :after adjusting confounding factors including age,sex,BMI,smoking,alcohol drinking,
                                                        a
                                                     b
                hypertension,dyslipidemia,AHI and T90;Adjusted model :additionally adjusted for diabetes treatment,HbA1c,the duration of diabetes.
                2.3 ODR与T2DM以及血管并发症的性别差异分析                        率均显著高于女性(FBG:6.28 mmol/L vs. 5.52 mmol/L,
                    男性OSA患者的FBG、HbA1c水平及T2DM患病                    P=0.012;HbA1c:7.20% vs. 6.30%,P=0.024;T2DM:

