Page 49 - 南京医科大学自然版
P. 49

第44卷第5期      张博为,韩卓莹,马天云,等. CTAGE15与食管鳞状细胞癌(ESCC)患者预后相关并抑制ESCC细胞的
                  2024年5月                恶性表型[J]. 南京医科大学学报(自然科学版),2024,44(5):634-642                    ·637 ·


                A                                               B
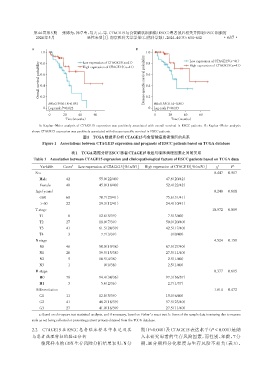
                    1.0                Low expression of CTAGE15(n=41)  1.0              Low expression of CTAGE15(n=41)

                   Overall survival probability  0.6  High expression of CTAGE15(n=41) Disease⁃specific survival probability  0.6
                    0.8
                                                                    0.8
                                                                                         High expression of CTAGE15(n=41)

                                                                    0.4
                    0.4

                    0.2
                       HR=0.39(0.18-0.85)                           0.2  HR=0.35(0.14-0.88)
                     0  Log⁃rank P=0.022                              0  Log⁃rank P=0.033
                        0     20     40     60                          0      20     40     60
                               Time(months)                                     Time(months)
                   A:Kaplan⁃Meier analysis of CTAGE15 expression was positively associated with overall survival in ESCC patients. B:Kaplan⁃Meier analysis
                shows CTAGE15 expression was positively associated with disease⁃specific survival in ESCC patients.
                                       图1 TCGA数据库分析CTAGE15与食管鳞癌患者预后的关系
                     Figure 1 Associations between CTAGE15 expression and prognosis of ESCC patients based on TCGA database


                                  表1 TCGA数据分析ESCC患者CTAGE15表达与临床病理因素之间的关系
                 Table 1  Association between CTAGE15 expression and clinicopathological factors of ESCC patients based on TCGA data

                                  b                                                                   2      a
                    Variable  Cases  Low expression of CTAGE15[%(n/N)]  High expression of CTAGE15[%(n/N)]  χ  P
                 Sex                                                                                0.447  0.517
                   Male         42             55.0(22/40)                    47.6(20/42)
                   Female       40             45.0(18/40)                    52.4(22/42)
                 Age(years)                                                                         0.248  0.618
                   ≤60          60             70.7(29/41)                    75.6(31/41)
                    > 60        22             29.3(12/41)                    24.4(10/41)
                 T stage                                                                           10.572  0.009
                   T1           08             12.8(5/39)0                     7.5(3/40)
                   T2           27             18.0(7/39)0                    50.0(20/40)
                   T3           41             61.5(24/39)                    42.5(17/40)
                   T4           03              7.7(3/39)                      0.0(0/40)
                 N stage                                                                            4.524  0.159
                   N0           46             50.0(19/38)                    67.5(27/40)
                   N1           26             39.5(15/38)                    27.5(11/40)
                   N2           05             10.5(4/38)0                     2.5(1/40)
                   N3           01              0.0(0/38)                      2.5(1/40)
                 M stage                                                                            0.377  0.615
                   M0           70             94.4(34/36)                    97.3(36/37)
                   M1           03              5.6(2/36)                      2.7(1/37)
                 Differentiation                                                                    1.614  0.472
                   G1           11             12.8(5/39)0                    15.0(6/40)0
                   G2           41             46.2(18/39)                    57.5(23/40)
                   G3           27             41.0(16/39)                    27.5(11/40)
                   a:Based on chi⁃square test statistical analysis, and if necessary, based on Fisher’s exact test. b:Some of the sample data is missing due to reasons
                such as not being collected or protecting patient privacy obtained from the TCGA database.

                2.2  CTAGE15 在 ESCC 患者临床样本中表达及其                   期(P=0.040)及CTAGE15表达水平(P < 0.001)是纳
                与患者病理特征的验证分析                                      入本研究患者的生存风险因素,而性别、年龄、T 分
                    临床样本的 COX 生存风险分析结果表明,N 分                      期、M 分期和分化程度与生存风险不相关(表 3)。
   44   45   46   47   48   49   50   51   52   53   54