Page 50 - 南京医科大学自然版
P. 50

第44卷第5期
               ·638 ·                            南 京    医 科 大 学 学         报                        2024年5月


              CTAGE15 虽然在 ESCC 中的表达上调(图 2A,P <                  P < 0.001)。
              0.001),但却与肿瘤的 T 分期(P < 0.01)及 N 分期                2.3  CTAGE15 表达对 KYSE⁃150 细胞恶性表型的
             (P < 0.001)呈负相关(图2B、C)。按照CTAGE15表                  影响
              达量中位数将 120 例 ESCC 患者分为高表达和低表                           与 HEEC 细胞相比,ESCC 细胞系 KYSE⁃150 细
              达两组。CTAGE15 高表达组的 T 分期、N 分期较早                     胞中 CTAGE15 表达显著上调(图 3A),在 siRNA 敲
              的比例高于 CTAGE15 低表达组(表 4)。Kaplan⁃                   低KYSE⁃150细胞中CTAGE15的表达后(图3B),划
              Meier法分析总体生存期也显示CTAGE15高表达组                       痕实验结果显示,KYSE⁃150 细胞(对照组、siRNA1
              患者的生存预后好于 CTAGE15 低表达组(图 2D,                      组、siRNA2 组、siRNA3 组的平均愈合率为 31.4%、


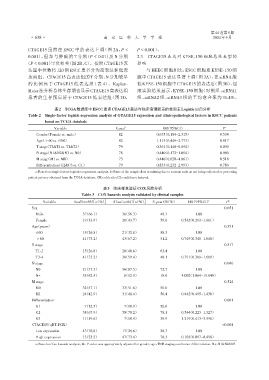
                          表2 TCGA数据库中ESCC患者CTAGE15表达与临床病理因素的单因素Logistic回归分析
              Table 2  Single⁃factor logistic regression analysis of GTAGE15 expression and clinicopathological factors in ESCC patients
                      based on TCGA databale

                          Variable                    Cases b               OR(95%CI)                   P a
                  Gender(Female vs. male)               82               0.675(0.184-2.315)            0.534
                  Age( > 60 vs. ≤60)                    82               1.113(0.449-2.773)            0.817
                  T stage(T3&T4 vs. T1&T2)              79               0.361(0.140-0.894)            0.030
                  N stage(N1&N2&N3 vs. N0)              78               0.440(0.172-1.094)            0.080
                  M stage(M1 vs. M0)                    73               0.446(0.020-4.861)            0.518
                  Differentiation(G2&G3 vs. G1)         79               0.833(0.232-2.993)            0.780
                 a:Based on single factors logistics regression analysis. b:Some of the sample data is missing due to reasons such as not being collected or protecting
              patient privacy obtained from the TCGA database. OR:odd ratio;CI:confidence interval.
                                                 表3  临床样本验证COX风险分析
                                       Table 3 COX hazards analysis validated by clinical samples

                     Variable      Dead(n=56)[n(%)]  Alive(n=64)[n(%)]  5⁃year OS(%)    HR(95%CI) a      P a
                Sex                                                                                      0.051
                  Male                 37(66.1)          36(56.3)          49.3            1.00
                  Female               19(33.9)          28(43.7)          59.6      0.542(0.293-1.001)
                Age(years)                                                                               0.551
                  ≤60                  15(26.8)          21(32.8)          58.3            1.00
                  > 60                 41(73.2)          43(67.2)          51.2      0.749(0.340-1.648)
                T stage                                                                                  0.517
                  T1⁃2                 15(26.8)          26(40.6)          63.4            1.00
                  T3⁃4                 41(73.2)          38(59.4)          48.1      0.791(0.389-1.609)
                N stage                                                                                  0.040
                  N0                   21(37.5)          56(87.5)          72.7            1.00
                  N+                   35(62.5)          08(12.5)          18.6      4.002(1.064-15.049)
                M stage                                                                                  0.524
                  M0                   32(57.1)          33(51.6)          50.8            1.00
                  M1                   24(42.9)          31(48.4)          56.4      0.842(0.495-1.430)
                Differentiation                                                                          0.061
                  G1                   07(12.5)          07(10.9)          50.0            1.00
                  G2                   38(67.9)          50(78.2)          78.1      0.544(0.223-1.327)
                  G3                   11(19.6)          07(10.9)          38.9      1.219(0.413-3.598)
                CTAGE15(qRT⁃PCR)                                                                        <0.001
                  Low expression       43(76.8)          17(26.6)          28.3            1.00
                  High expression      13(23.2)          47(73.4)          78.3      0.103(0.097-0.498)
                 a:Based on Cox hazards analysis,the P⁃value was appropriately adjusted for gender,age,TNM staging,and tumor differentiation. N+:N1&N2&N3.
   45   46   47   48   49   50   51   52   53   54   55