Page 29 - 南京医科大学自然版
P. 29

第44卷第6期         张丽君,李     琳,斯 岩,等. UBE2T通过JAK⁃STAT通路促进甲状腺乳头状癌细胞增殖[J].
                  2024年6月                     南京医科大学学报(自然科学版),2024,44(6):762-768                        ·765 ·


                A              ***     B                                             C
                                                      P2
                                                           P3
                                                P1
                     4.5                  UBE2T  N T  N T  N T  23 kDa   4 3  ***            Nthyori 3⁃1 KTC⁃1 B⁃CPAP
                                                                                                 TPC⁃1
                                                                                                         IHH4
                  Expression of UBE2T  (TPM+1) 4.0  GAPDH  N T  N T  N T  37 kDa  Relative UBE2T  protein exprssion  2 1  GAPDH  *** **  23 kDa
                                                                                       UBE2T
                     3.5
                                                P4
                                                                                                            37 kDa
                                                           P6
                                                      P5
                     3.0
                    Log2
                                                              23 kDa
                                          UBE2T
                     2.5
                     2.0
                     1.5                 GAPDH                37 kDa     0   N    T         Relative UBE2T  protein exprssion 8 6 4  ** ***
                            N      T                                                           2
                D                                                E             **              0
                         1.0
                                                                                             Nthyori 3⁃1
                                                                                                       B⁃CPAP
                                                                      5                           TPC⁃1 KTC⁃1  IHH4
                        Survival probability  0.5                     3
                         0.8
                                                                      4
                         0.3
                                               UBE2T low expression  Exprssion of UBE2T  2
                                               UBE2T high expression  1
                            P=0.003
                          0  HR=3.43,95%CI(1.43-8.21)
                            Number at risk                            0
                 Low expression 194  61      17       5
                 High expression 158  44     14       5
                                                                     -1
                            0       1 355   2 710    4 065    5 420
                                                                        N0(n=229) N1(n=225)
                                             DFI
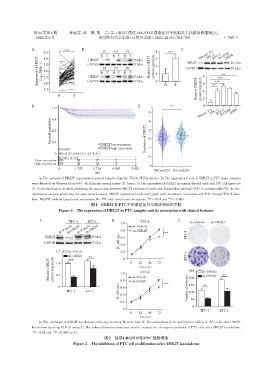
                   A:The analysis of UBE2T expression in paired samples from the TCGA⁃THCA dataset. B:The expression levels of UBE2T in PTC tissue samples
                were detected by Western blot(n=6). N:Adjacent normal tissue;T:Tumor. C:The expression of UBE2T in normal thyroid cells and PTC cell lines(n=
                3). D:Bioinformatics analysis predicting the association between UBE2T expression levels and disease⁃free interval(DFI)in patients with PTC. E:Bio⁃
                informatics analysis predicting the association between UBE2T expression levels and lymph node metastasis in patients with PTC through THCA data⁃
                                                                     **
                base. N0:PTC without lymph node metastasis;N1:PTC with lymph node metastasis. P < 0.01 and  *** P < 0.001.
                                           图1 UBE2T在PTC中的表达及其与临床特征的关联
                            Figure 1 The expression of UBE2T in PTC samples and its association with clinical features
                   A             TPC⁃1   KTC⁃1       B            TPC⁃1            C
                                                         1.0                             sh⁃Vehicle  sh⁃UBE2T
                            sh⁃Vehicle  sh⁃Vehicle       0.8  sh⁃Vehicle
                                sh⁃UBE2T
                                         sh⁃UBE2T
                                                              sh⁃UBE2T
                      UBE2T                23 kDa       nm)  0.6            ***        TPC⁃1
                                                        (450  0.4
                     GAPDH                 37 kDa
                           1.5   sh⁃Vehicle             D  0.2
                                 sh⁃UBE2T  **             0                            KTC⁃1
                        Relative UBE2T  protein expression  1.0  1.0  0 sh⁃Vehicle  48  72  250  sh⁃Vehicle  **
                                 ***
                                                                 24
                                                                 Time(h)
                                                                  KTC⁃1
                           0.5
                                                                                              sh⁃UBE2T
                                                        nm)  0.8  sh⁃UBE2T   ***        200    **
                                                                                        150
                            0                            0.6                            Number of colonies
                                                        (450  D  0.4
                                TPC⁃1    KTC⁃1                                          100
                                                         0.2                             50
                                                                                          0
                                                          0                                  TPC⁃1    KTC⁃1
                                                             0   24  48   72
                                                                 Time(h)
                   A:The validation of UBE2T knockdown efficiency by using Western blot. B:The assessment of the proliferative ability of PTC cells after UBE2T
                knockdown by using CCK⁃8 assay. C:The colony formation assay was used to evaluate the clonogenic potential of PTC cells after UBE2T knockdown.
                **       ***
                 P < 0.01 and  P < 0.001(n=3).
                                                 图2   敲减UBE2T抑制PTC细胞增殖
                                   Figure 2  The inhibition of PTC cell proliferation after UBE2T knockdown
   24   25   26   27   28   29   30   31   32   33   34