Page 31 - 南京医科大学自然版
P. 31

第44卷第6期         张丽君,李     琳,斯 岩,等. UBE2T通过JAK⁃STAT通路促进甲状腺乳头状癌细胞增殖[J].
                  2024年6月                     南京医科大学学报(自然科学版),2024,44(6):762-768                        ·767 ·


                A   0.5  JAK STAT signaling pathway  B        TPC⁃1  KTC⁃1        sh⁃Vehicle         sh⁃Vehicle
                                                                                    TPC⁃1
                                                                                                        KTC⁃1
                   Enrichment score  0.4 0        p⁃STAT3  sh⁃Vehicle sh⁃Vehicle 86 kDa  2.5  sh⁃UBE2T  2.5  sh⁃UBE2T
                                                                  sh⁃UBE2T
                                                            sh⁃UBE2T
                    0.3
                    0.2
                                                                             2.0
                                                                                                2.0
                    0.1
                                                   STAT3
                                                                             1.0
                                                                                                1.0
                                                                    37 kDa
                                                  GAPDH             86 kDa  Relative protein expression  1.5  ***  Relative protein expression  1.5  ***
                  Ranked list metric  0.8   Low                               0  p⁃STAT3  STAT3   0  p⁃STAT3  STAT3
                                                                             0.5
                                                                                                0.5
                        High
                    1.0
                    0.6
                    0.4
                    0.2
                    0.0
                   -0.2
                         5 000 10 000  15 000 20 000 25 000 30 000
                        0
                           Rank in ordered data set
                C         TPC⁃1                    KTC⁃1        D    sh⁃UBE2T Colivelin+sh⁃UBE2T   sh⁃UBE2T
                        sh⁃UBE2T                sh⁃UBE2T                                           Colivelin+sh⁃UBE2T
                   1.0                      1.0
                        Colivelin+sh⁃UBE2T      Colivelin+sh⁃UBE2T                              200          *
                  nm)  0.8        ***      nm)  0.8        **      TPC⁃1                        150
                  (450 0.6                 (450 0.6                                            Number of colonies  100  *
                                            0.4
                   0.4
                  D
                                           D
                   0.2
                    0                       0.2 0                  KTC⁃1                         50
                       0  24 48 72              0  24 48 72                                       0
                          Time(h)                 Time(h)                                           TPC⁃1  KTC⁃1
                E              TPC⁃1                            F              KTC⁃1
                       sh⁃UBE2T  Colivelin+sh⁃UBE2T                     sh⁃UBE2T  Colivelin+sh⁃UBE2T
                                                (%)  150  TPC⁃1                                  (%)  150  KTC⁃1
                                                Wound closure rate  50 0                         Wound closure rate  50
                   0 h                           100                h  0                         100
                                                                                                   0
                                                  sh⁃UBE2T
                                                                                                   sh⁃UBE2T
                   h                             Colivelin+sh⁃UBE2T  h                            Colivelin+sh⁃UBE2T
                   24                                               24
                G            Migration                          H             Invasion
                      sh⁃UBE2T  Colivelin+sh⁃UBE2T                     sh⁃UBE2T  Colivelin+sh⁃UBE2T
                                                  sh⁃UBE2T                                         sh⁃UBE2T
                                                  Colivelin+sh⁃UBE2T                               Colivelin+sh⁃UBE2T
                  TPC⁃1                        60                  TPC⁃1                         60
                                              Migration cells per field  40                     Invasion cells per field  40


                                                                                                 20
                                               20
                  KTC⁃1                         0  TPC⁃1  KTC⁃1    KTC⁃1                         0  TPC⁃1  KTC⁃1


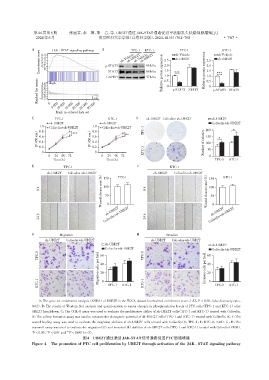
                   A:The gene set enrichment analysis(GSEA)of UBE2T in the TCGA dataset(normalized enrichment score=1.83,P < 0.01,false discovery rate=
                0.02). B:The results of Western blot analysis and quantivication to assess changes in phosphorylation levels of PTC cells(TPC⁃1 and KTC⁃1)after
                UBE2T knockdown. C:The CCK⁃8 assay was used to evaluate the proliferative ability of sh⁃UBE2T cells(TPC⁃1 and KTC⁃1)treated with Colivelin.
                D:The colony formation assay was used to measure the clonogenic potential of sh⁃UBE2T cells(TPC⁃1 and KTC⁃1)treated with Colivelin. E,F:The
                wound healing assay was used to evaluate the migration abilities of sh⁃UBE2T cells treated with Colivelin(E:TPC⁃1;F:KTC⁃1;×40). G,H:The
                transwell assay was used to evaluate the migration(G)and invasion(H)abilities of sh⁃UBE2T cells(TPC⁃1 and KTC⁃1)treated with Colivelin(×100).
                *     **        ***
                P < 0.05,P < 0.01 and  P < 0.001(n=3).
                                       图4   UBE2T通过激活JAK⁃STAT信号通路促进PTC细胞增殖
                Figure 4  The promotion of PTC cell proliferation by UBE2T through activation of the JAK ⁃ STAT signaling pathway
   26   27   28   29   30   31   32   33   34   35   36